General Topics

QUESTIONS
This tutorial is split into two sections. The first covers basic cardiac terminology, physiological concepts and the physical principles underlying ultrasound and echocardiography (ECHO). The second covers other forms of non-invasive and invasive cardiac output monitoring. At the end of these two tutorials, you should be able to answer the following questions:
Define the following: –
- Cardiac Output
- Cardiac Index
- Stroke Volume
- Preload
- Venous Return
- Afterload
- Systemic Vascular Resistance
- Contractility
- Mean Arterial Pressure
- Ejection Fraction
What clinical signs can be used as markers of cardiac output?
What features would an ideal cardiac output monitor have?
Name the commonly used forms of cardiac output monitoring.
Explain the physical principles underlying the most common forms of cardiac output monitor.
Compare and contrast the features of the commonly used forms of cardiac output monitoring equipment.
INTRODUCTION
The aim of haemodynamic monitoring and support in the critically ill is to optimise oxygen delivery to the tissues.
Oxygen delivery is determined by cardiac output (flow), and amount of oxygen carried in the blood.
Cardiac output monitoring therefore allows us to assess flow of blood to the tissues, and provides information on how best to support a failing circulation.
CASE HISTORY AND SELF-ASSESSMENT
A 64-year-old woman, Mrs JW, with a past medical history of hypertension and paroxysmal atrial fibrillation is admitted to A&E with severe chest pain. On examination she is sweaty with cool peripheries, tachycardic at 140bpm and hypotensive 80/50mmHg. Her heart rate and blood pressure deteriorate despite resuscitative measures. ECG shows marked ST segment depression and she has a positive Troponin. She is diagnosed with a myocardial infarction and is transferred to the critical care unit for inotropic and vasopressor support.
Consider the following:
- What are the possible causes of shock in this patient?
- What other features of the examination or simple bedside tests could you also use to form an opinion about her cardiac output?
- What investigations could you order to better assess her cardiac output?
- How could a cardiac output monitor guide therapy?
DEFINITIONS
- Shock
- Failure to deliver adequate oxygen to the tissues.
- Cardiac Output
- Volume of blood ejected from the left ventricle per minute (the product of stroke volume and heart rate).
- Influenced by preload, contractility and afterload.
- Cardiac index is cardiac output adjusted for body size.
- Stroke Volume
- Volume of blood ejected from the ventricle in a single contraction.
- Usually 60-80 ml for an adult.
- Preload
- End-diastolic ventricular wall tension (i.e. tension at the point of maximal filling) – mainly determined by venous return, and an indicator of filling pressures.
- Venous Return
- The blood entering the right atrium per minute.
- Afterload
- Tension developed in the ventricular wall during systole (i.e. the tension generated in order to eject blood during systole) – largely determined by the systemic vascular resistance.
- Systemic Vascular Resistance
- All the forces that oppose blood flow through the systemic vasculature.
- Predominantly determined by vasoconstriction in the arteriolar bed.
- Contractility
- The amount of mechanical work that the heart can do at a given preload and afterload (an intrinsic ability of the heart).
- Mean Arterial Pressure (MAP)
- Average arterial blood pressure throughout the cardiac cycle. As 2/3 of the cardiac cycle is spent in diastole, and 1/3 in systole, MAP may be calculated using the formula:
- MAP = (Systolic BP + 2 x Diastolic BP) / 3, Or
- MAP = Diastolic BP + 1/3(Systolic BP – Diastolic BP)
- Average arterial blood pressure throughout the cardiac cycle. As 2/3 of the cardiac cycle is spent in diastole, and 1/3 in systole, MAP may be calculated using the formula:
- Ejection Fraction
- The fraction of total blood in a ventricle that is ejected per beat.
- Applies to both left and right ventricles.
- An index of contractility.
- Normal value in region of 55-65%.
CLINICAL INDICATORS OF CARDIAC OUTPUT
The clinical signs of cardiac output pertain to the state of end-organ tissue perfusion. No single clinical sign can be used to make an accurate assessment of cardiac output. However, if used together they can be useful in estimation of cardiac output.
Clinical signs include:
- Skin colour
- Skin temperature, and core-peripheral temperature difference
- Capillary Refill Time
- Heart Rate
- Urine Output
- Mental State
Note that although blood pressure is often used as an indicator of cardiac output, it is frequently unhelpful. Blood pressure may be maintained by intense peripheral vasoconstriction in the face of a perilously low cardiac output.
Learning point – blood pressure is a poor indicator of cardiac output.
Lactate
Lactate is produced by anaerobic metabolism, and is an indicator of tissue hypoperfusion. It is measured in the laboratory, and most modern blood gas machines now give a lactate value as part of arterial blood gas analysis. It can be used to monitor therapy, as it will fall as oxygen delivery improves, and as liver perfusion (which enables lactate metabolism) increases.
Features of an ideal cardiac output monitor
The ideal cardiac output monitor would:
- Be accurate
- Give measurements that are reproducible
- Be quick and easy to use (both in terms of set-up and interpretation of information)
- Be operator independent (i.e. the skill of the operator doesn’t affect the information collected)
- Provide continuous measurement
- Be safe
Doppler Ultrasound and Echocardiography
Ultrasound
Ultrasound is any high-frequency sound wave. Ultrasound is used medically to create a 2 dimensional image by using a probe to transmit high-frequency sound waves (1-5MHz) into the body, and to detect the waves as they are reflected off the boundaries between tissues of differing acoustic densities. By using a mathematical model involving the speed of sound and the intensity and timing of each echo’s reflection, the distance from the probe to the tissue boundaries is calculated, and used to create a twodimensional image.
Doppler Ultrasound
When sound waves are reflected from a moving object, their frequency is altered. This is the Doppler Effect. By using an ultrasound probe to visualise directional blood flow, the phase shift (i.e. the change in frequency before and after reflection off moving red blood cells) can be determined. This, together with the cross-sectional area of the blood vessel being observed (measured or estimated) can be used to determine flow
Flow = area x velocity
Oesophageal Doppler
The Doppler probe is passed into the oesophagus (approx 35cm from lips/teeth – Figure 1)
The probe is rotated until the transducer faces the descending aorta (the oesophagus and descending aorta run close and parallel to each other) and a characteristic waveform is seen.
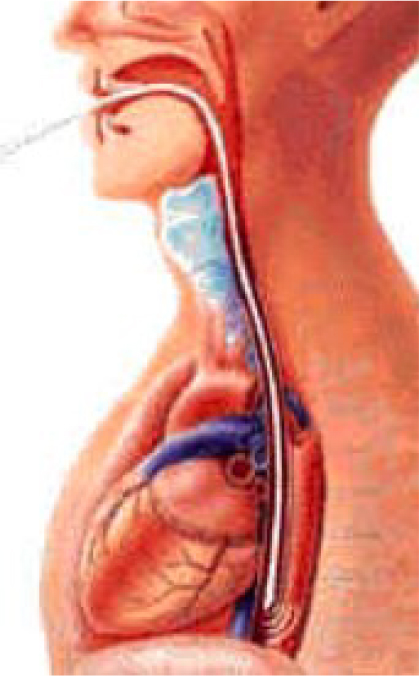
Figure 1. Oesophageal Doppler Probe Placement reproduced from Deltex Medical CardioQÒ manual
Waveform Interpretation
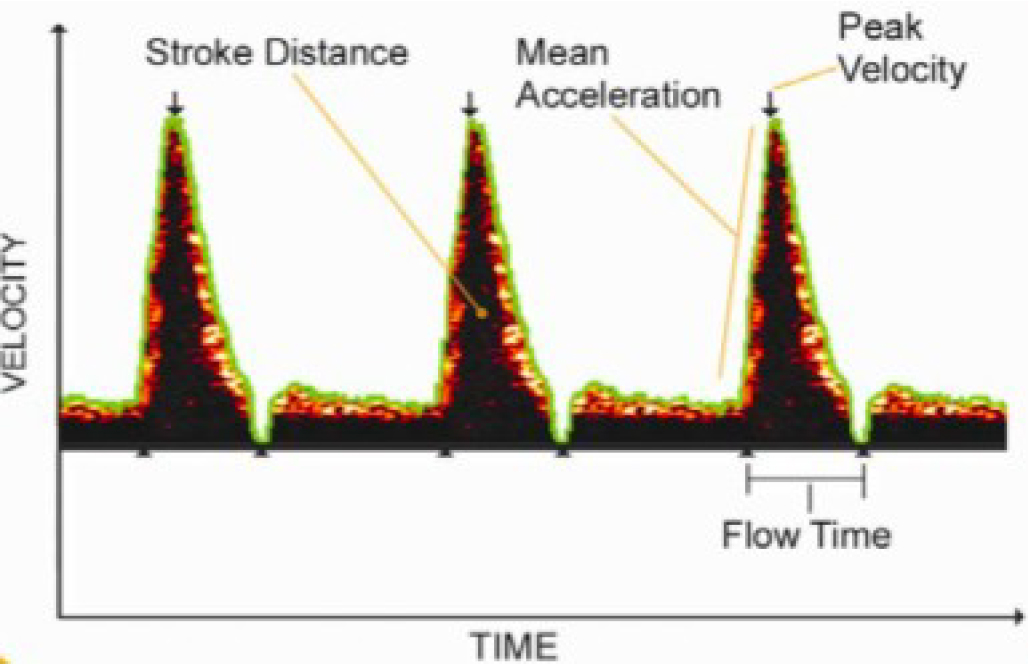
Figure 2. Image of Descending Aortic Waveform (from Deltex Medical CardioQÒ manual) Aortic area is not measured using this method, it is estimated using an algorithm based on body surface area.
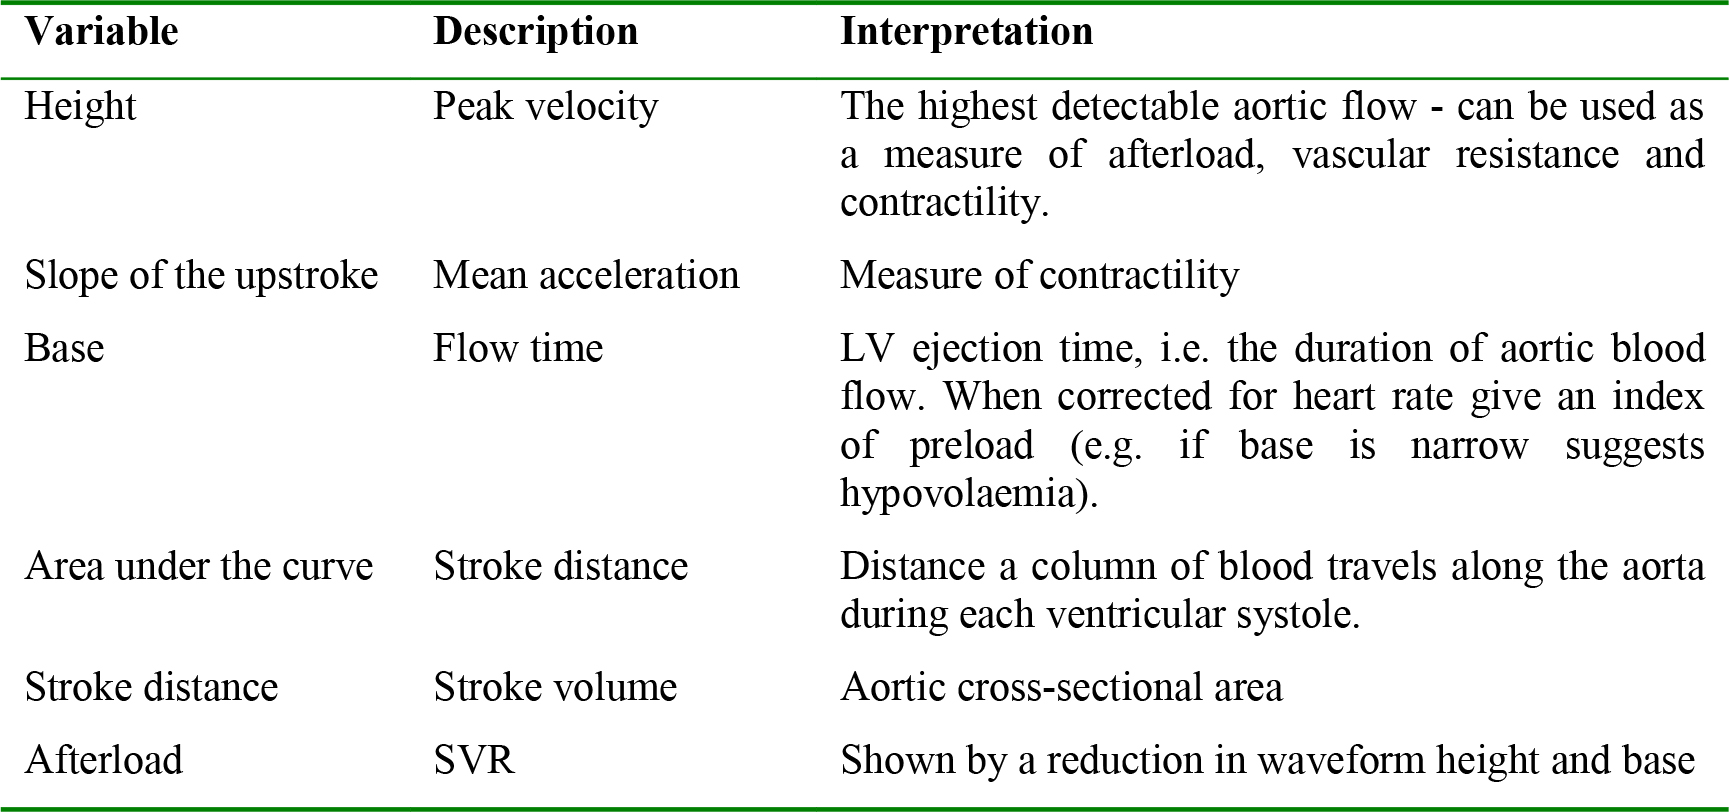
Table 1. Interpretation of waveform variables
Advantages
- Minimally invasive
- Minimal interference form bone, lung and soft tissue (as seen with transthoracic route)
- Quickly inserted and analysed
- Little training required
- Very few complications
Disadvantages
- May require sedation
- User dependent
- Interference from surgical instruments eg. Diathermy impairs signal
- Depends on accurate probe positioning
- Probe may detect other vessels e.g. intracardiac/intrapulmonary
- Assumes a constant percentage of cardiac output (approx 70%) enters the descending aorta. May therefore be inaccurate in a hypovolaemic patient where flow may be redirected to the cerebral circulation.
The oesophageal doppler is a reasonable cardiac output monitor to follow trends, and response to fluid challenges.
Echocardiography
Echocardiography is cardiac ultrasound and can be used to estimate cardiac output by direct visualisation of the contracting heart in real time.
Ultrasound and echocardiography are gaining acceptance as one of the safest and most widely used cardiac output monitors in the critically ill. Focused echocardiography in the critically ill is increasingly being used to answer 4 specific questions:
- What is the function of the left ventricle?
- Is the right side of the heart enlarged?
- Is there a pericardial effusion?
- In the case of pulseless electrical activity (PEA), is there any mechanical activity in the heart?
A focused echocardiogram can be performed in a matter of minutes, and, if interpreted with these four questions above in mind, can be an invaluable tool in determining the cause of haemodynamic instability. Four views are obtained (parasternal long axis, parasternal short axis, apical, and subcostal), and it is possible to make an assessment of ventricular function and size of cardiac chambers with these four views alone.
a) Transthoracic Approach
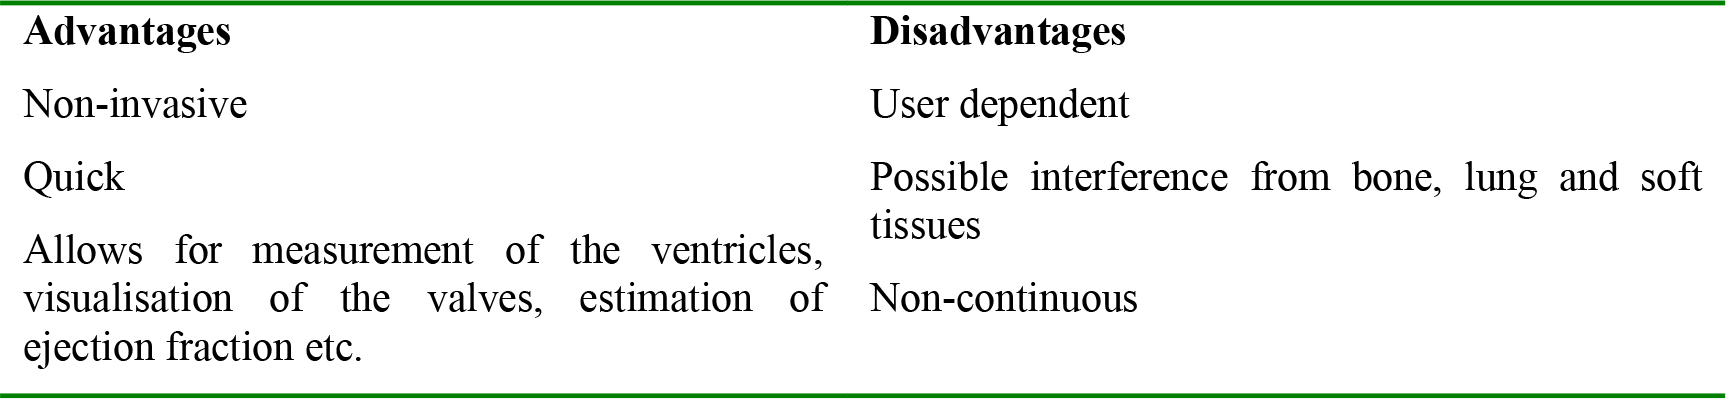
Table 2. Advantages and disadvantages of transthoracic echocardiography
b) Transoesophageal ECHO (TOE)
The transoesophageal ECHO probe is passed into the oesophagus, and the probe rotated until the transducer faces the heart.
TOE is especially good for looking at the aortic valve, and right side of the heart.
SUMMARY
The assessment of cardiac output is a central part of haemodynamic monitoring and support in the critically ill patient. Available methods should be considered in terms of the information needed, and the safety of using the monitor.
Echocardiography is non invasive, safe, and widely applicable, and is becoming increasingly used as the cardiac output monitor of choice.
The second part of this tutorial will discuss other, more invasive forms of cardiac output monitoring (e.g. PICCO, LiDCO, Pulmonary Artery Catheters), and will provide answers to the questions.
SUGGESTED FURTHER READING
- Chakravarthy, M. Cardiac output – Have we found the ‘gold standard’. Annals of Cardiac Anaesthesia (2008), Volume 11, Issue 1, Pages 56-68
- Prabhu, M. Cardiac Output Monitoring. Anaesthesia and Intensive Care (2007), Volume 8, Issue 2, Pages 63-66
- Kuper, M., Soni, N. Non-invasive Cardiac Output Monitors. CPD Anaesthesia (2003); 5: 17-25
- Allsager, C.M., Swanevelder, J. Measuring Cardiac Output. British Journal of Anaesthesia – CEPD Reviews. (2003) Volume 3, Number 1, Pages 15-19
- Boldt, J. Hemodynamic monitoring in the intensive care unit. Critical Care (2002); 6: 52-9
This work by WFSA is licensed under a Creative Commons Attribution-NonCommercial-NoDerivitives 4.0 International License. To view this license, visit https://creativecommons.org/licenses/by-nc-nd/4.0/