General Topics

KEY POINTS
- Cardiopulmonary exercise tolerance testing (CPET) is useful in predicting perioperative
- It aids multidisciplinary team (MDT) decision making and facilitates informed
- During CPET, measurements of oxygen (O2) consumption, carbon dioxide (CO2) production and ventilatory changes during a rampedincrease in exercise are made, whilst noninvasive O2 saturations (SpO2), blood pressure (BP) and an electrocardiogram (ECG) are continuously recorded.
- The peak O2 consumption, anaerobic threshold and ventilatory equivalents for CO2 are suggested predictors of postoperative mortality in a variety of surgical procedures.
- A patient’s CPET performance provides a prehabilitation baseline, which guides preoptimisation
- Under the governance of the Perioperative Exercise Testing and Training Society (POETTS), CPET provision has been standardised to achieve high-quality, reliable and comparable data.
INTRODUCTION
Cardiopulmonary exercise tolerance testing (CPET) is a dynamic, noninvasive assessment of the cardiopulmonary system at rest and during exercise, performed preoperatively to determine functional capacity. Questioning a patient regarding their exercise tolerance is part of a routinepreoperative assessment and provides an indication of a patient’s comorbidity and frailty. CPET goes further to quantify the degree and nature of physiological deficit based on the pattern of deviation from the norm within CPET data.
We will examine key CPET variables, explore common patterns of physiological deviation by exercise-limiting pathology and then explain how touse these results to plan the perioperative journey. An in-depth review of physiological response to exercise is not provided in this tutorial. It is,however, useful to revise the Fick equation to understand how O2 consumption (VO2) can be calculated from CPET measurements. A widely accepted definition of the Fick principle states, ‘The total uptake or release of a substance by peripheral tissues is equal to the product of the blood flow to the peripheral tissues and the arterio-venous concentration difference of the substance’1.
where VO2 is the total O2 consumption per unit time, HR is heart rate, SV is the volume of blood ejected from the left ventricle during each systolic contraction and a-vO2 is difference in the arterial and venous O2 content. During CPET, an indirect Fick method is used that includes estimations of SV based on the patient’s demographics and measurements of inspiratory and expiratory O2 concentrations.
EXERCISE TOLERANCE
To achieve a normal exercise tolerance, the body needs to adequately achieve the following:
- Ventilation
- Gas exchange
- Delivery of oxygenated blood to exercising tissues and return of CO2 to the lungs
- Extraction of O2 by the muscle and transfer of CO2 to the blood
- Appropriate use of O2 within mitochondria to generate energy as adenosine triphosphate (ATP)
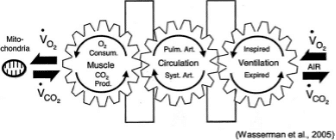
This well-known diagram by Wasserman illustrates these 5 stages. VO2 = rate of O2 uptake, VCO2 = rate of CO2 production. In reality, the body is not in a steady state. Permission to use image granted by the publisher for Wasserman et al.2
O2 consumption (VO2) is the amount of O2 taken in and used by the body per unit time and is thus the rate of O2 use. CO2 production (VCO2) is the amount of CO2 exhaled from the body per unit time (see Figure 1).2
Increased VO2 by the muscles results from increases in the following:
- O2 extraction from the blood at the exercising muscles
- O2 delivery, by a decrease in local vascular resistance
- Cardiac output, through increased heart rate and stroke volume
- Pulmonary blood flow
- Linear increase in minute ventilation through increased tidal volume and ventilatory frequency
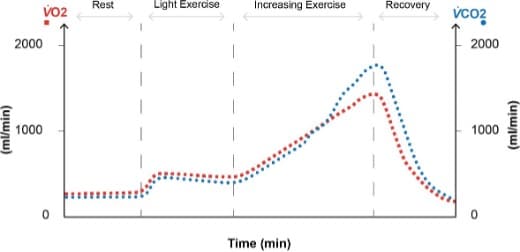
Figure 2. Normal response to exercise: at rest, our oxygen consumption ( VO2) is approximately 250 mL min 1 with a lower CO2 production
( VCO2) of varying fraction depending on diet. VO2 increases on light exercise such as slow walking, as does VCO2, proportionally. VO2 and
VCO2 increase linearly with increasing work rate. Anaerobic metabolism then further increases CO2 production without any further utilisation of
O2, illustrated here where trendlines cross.
At rest, VO2 is approximately 3.5 mL kg-1min-1. During strenuous exercise, this can increase by more than 10 to 20 times, requiring a large cardiopulmonary response to deliver the required O2 to the muscles (see Figure 2). Measuring VO2 is of particular interest during exercise because it reflects the needs of the body in a stressed, perioperative state. It is recognised that patients who are less physically fit are more likely to experience adverse perioperative outcomes.
CPET VARIABLES
A magnetically braked (or similar) cycle ergometer with a predetermined ramp of pedalling resistance provides a reliable, gradual increase in work rate (in Watts). A treadmill or hand ergometer is an alternative. The breath-by-breath expired gas concentrations are commonly measuredusing rapid infrared gas analysers, while flow is measured by pressure differential pneumotachographs. This enables calculation of VO2 and VCO2, together with spirometry and respiratory rate. Serial measurements of electrocardiogram (ECG), O2 saturation (SpO2) and blood pressure (BP) are also recorded. From the primary values of VO2, VCO2, minute ventilation (VE) and HR, secondary values can be calculated, such as ventilatory equivalents for CO2 (VE/VCO2). These terms are explained below. Trends are represented graphically by computer software and displayed in a ‘9-panel plot’, where the cardiovascular system isrepresented by panels 2, 3 and 5; ventilation is represented by panels 1, 4 and 7; and panels 6, 8 and 9 show ventilation-perfusion (VQ) relationships.
VO2 Peak
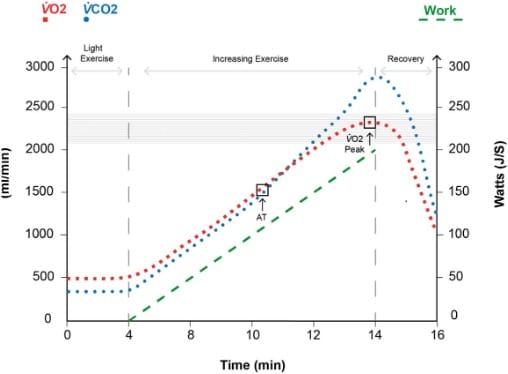
Figure 3. VO2 peak: a 20-second-averaged maximum oxygen consumption is recorded during the peak of the subject’s work rate. Typically,
this will be the time preceding the transition to recovery or prior to stopping the test prematurely due to patient exhaustion. The VO2 peak
recorded may be the patient’s ‘best effort’; however, it is not a physiological limit and is therefore not their highest attainable VO2. As work
increases, if VO2 begins to plateau, this represents the highest attainable VO2 for a subject and is known as maximal VO2 or VO2 max. Noting
the linear relationship between work rate and VO2, the increase in the VO2 (red squares) should parallel the increase in work (green dash). The
horizontal shading indicates the patient’s 80-100% predicted VO2 peak given their demographics.
The VO2 increases linearly at a rate of 10 mL of O2-min-1 for every 1-W increase in power.3 Any level significantly lower than this could imply a limitation in the patient’s physiological reserve. The limit of tolerated exercise is reached at a plateau threshold known as the maximum O2 consumption (VO2max). In the case of an increasing ramp CPET, where a shorter duration of increasing work rate is used and where we would not be certain of a plateau threshold, we use the peak O2 consumption (VO2peak). The VO2peak is usually measured over a 20-second average of peak O2 consumption (see Figure 3).
Research has elicited different VO2peak thresholds of increased risk for different surgery types. In general, a VO2peak of <15 mL O2 kg-1-min-1 is considered to represent an increased risk of perioperative complications.
Anaerobic Threshold
The anaerobic threshold (AT) is the point at which the cardiopulmonary system is unable to meet the O2 demand of the muscles. Muscle cellsgenerate ATP by switching to anaerobic metabolism, a process that produces lactic acid. Lactic acid is buffered by our bicarbonate buffer system, and further CO2 is generated.
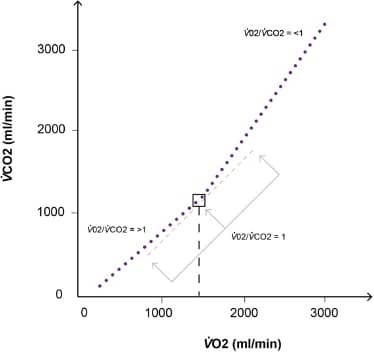
Figure 4. The ‘V-slope’ method plotting VO2 against VCO2. Initially, there is a steady rise in both parameters. At the anaerobic threshold, the VCO2 will increase in relation to the VO2, increasing the gradient of the curve. Wasserman’s method was to plot a straight line of best fit through the initial and final parts of the curve. The intersection of these 2 lines would be the AT. The ‘modified V-slope’ method may also be used (shown). Here, a VO2/VCO2 = 1 gradient line is brought in from the right, and the point at which it touches the curve and the dots pull away from it with increasing gradient is the AT.
CO2 output will climb in proportion to O2 consumption until the AT, at which point the change in VCO2 (ΔVCO2) exceeds the change in VO2 (ΔVO2). This can be seen on a ‘V-slope’ plot of VCO2 against VO2 (see Figure 4).
Values of AT indicating increased risk vary depending on the type of surgery. That said, an AT of <11 mL O2 kg-1 min-1 would put the patient into a higher-risk group.4
Ventilatory Equivalents
These are indicators of ventilatory efficiency, representing the ratio of minute ventilation (VE) to CO2 output or O2 uptake. They provide us insight into the efficiency of VQ matching in the lung and that of gas exchange. If we consider the VE required to support an increase in VO2 and VCO2, a lower VE (and therefore a lower ratio) would represent greater efficiency.
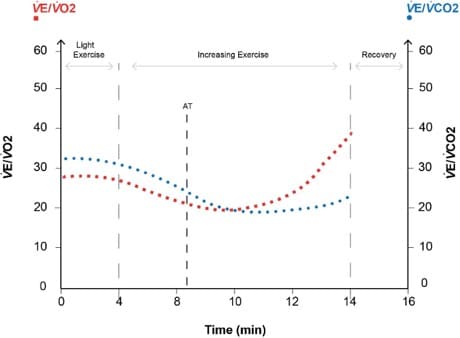
Figure 5. Ventilatory equivalents. AT is at the point at which divergence begins. Increased CO2 production drives minute ventilation up, and
therefore, while oxygen consumption remains constant, the VE/VO2 ratio increases with respect to VE/VCO2.
Plotting the ventilatory equivalents for VO2 and VCO2 against time with increasing exercise intensity, we see a small initial improvement in theventilatory efficiency. This is due to decreased dead space ventilation as the tidal volumes increase at the start of exercise (see Figure 5).
Beyond the AT, lactate produced is buffered by the bicarbonate system generating more CO2, which acts on chemoreceptors and subsequentlythe respiratory center, increasing VE. Initially, there is an isocapnic buffering phase in which VE/ VCO2 remains the same, but the VE/VO2 rises, as relatively no more O2 is being consumed. The divergence of the VE/VO2 and VE/VCO2 lines at this point is another way of marking the AT. The VE/VCO2 at the AT is the value that is reported and is usually less than 34. The higher the level, the higher the perioperative risk.
INTERPRETATION OF CPET DATA
The test may be too physically demanding for the patient to generate adequate data for interpretation; however, the inability to complete a test is a useful measure in predicting poor surgical outcome.
1. Was the test terminated prematurely?
Adapted from the American Thoracic Society, POETTS have consensus guidelines on the reasons for premature termination of the CPET.5 These include the following:
- Angina: > 2 mm ST depression if symptomatic or 4 mm if asymptomatic or >1 mm ST elevation
- Arrythmia causing symptoms or haemodynamic compromise
- Hypotension: systolic BP drop of >20 mm Hg from the highest value during the test
- Hypertension
- Systolic BP >250 mm Hg
- Diastolic BP >120 mm Hg
- Desaturation: SpO2 <80%
- Loss of coordination or mental confusion
- Dizziness or faintness
2. Is the test maximal?
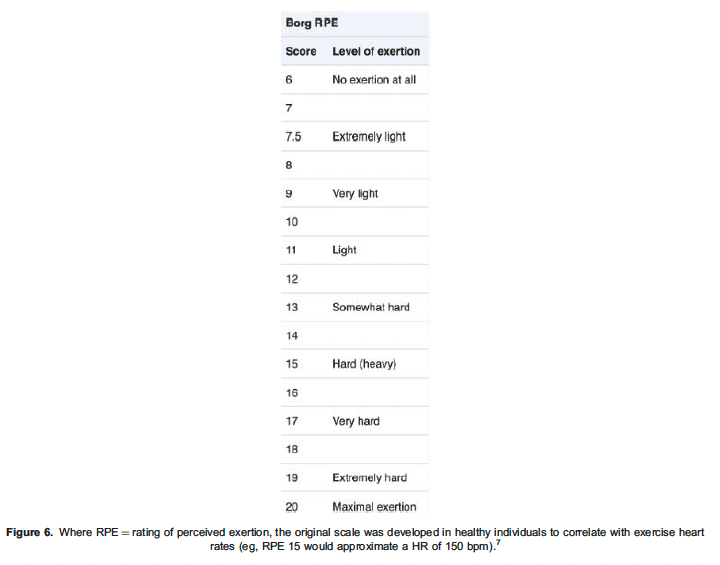
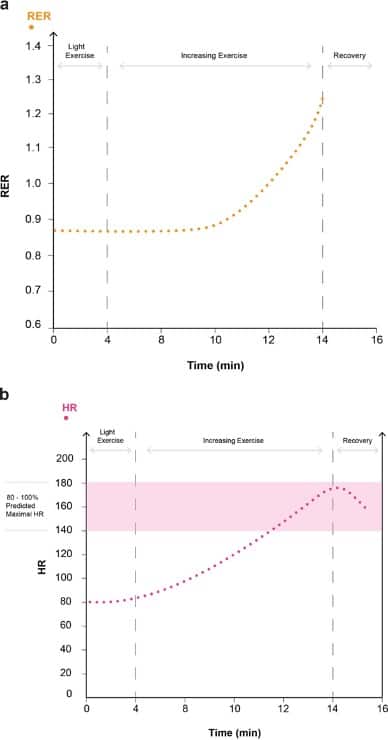
Figure 7. Markers of a maximal test. Increasing RER to >1.15 within the exercising period is indicative of a maximal test. Achieving >80% maximal HR as indicated by HR within the 80-100% predicted maximal HR reference zone is also indicative of a maximal test.
The patient will usually stop when they are symptom limited and cannot exercise any longer. It is possible to grade their symptoms with a suitable scale, such as the Borg scale, at this point (see Figure 6) 6. The reason for stopping must be ascertained, such as tired legs, dyspnoea, or pain. See Figure 7a,b for markers of a maximal test.
The respiratory exchange ratio (RER) is the ratio of VCO2/VO2 and corresponds to gas exchange. At a basal metabolic rate, it represents tissue metabolism and equates to the respiratory quotient (RQ). Metabolism of carbohydrate, protein and fat result in RQs of 1, 0.8 and 0.7, respectively. Because extra CO2 is introduced into the system during anaerobic exercise from bicarbonate buffering of lactic acid, an RER substantially greater than 1 at peak exercise is one marker of maximal effort.
Physiological markers of a maximal test include the following:
- >80% predicted work rate (as per demographics)
- >80% maximal HR (predicted maximum = 220 beats-min–1 – age)
- Heart rate reserve (HRR) of <15% would indicate a maximal test, where HRR = predicted maximum HR – maximum HR achieved during the test; a raised HRR could represent a submaximal test or chronotropic insufficiency
- Achieving an RER >1.15
- Achieving maximal predicted VE
COMMON PATTERNS OF PHYSIOLOGIAL LIMITATION
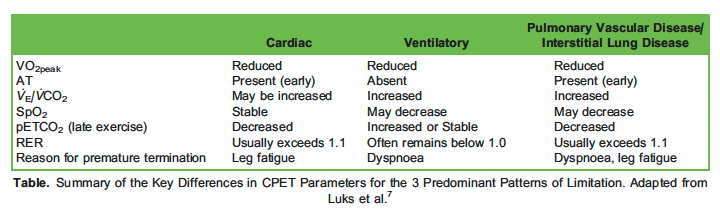
We will now examine 3 common patterns of physiological limitation by exercise-limiting pathology (see Table) 7.
Cardiovascular Limitation
In individuals with valvular or ischaemic cardiac pathology, there is a circulatory delivery issue of gases between the muscles and the lungs. An individual with a cardiac limitation may display a normal CPET pattern but with a lower than predicted VO2peak and an early-onset AT. The typical performance-limiting symptom will be leg fatigue due to O2 delivery failure and lactic acidosis at the tissue level, rather than dyspnoea. Patients may develop angina.
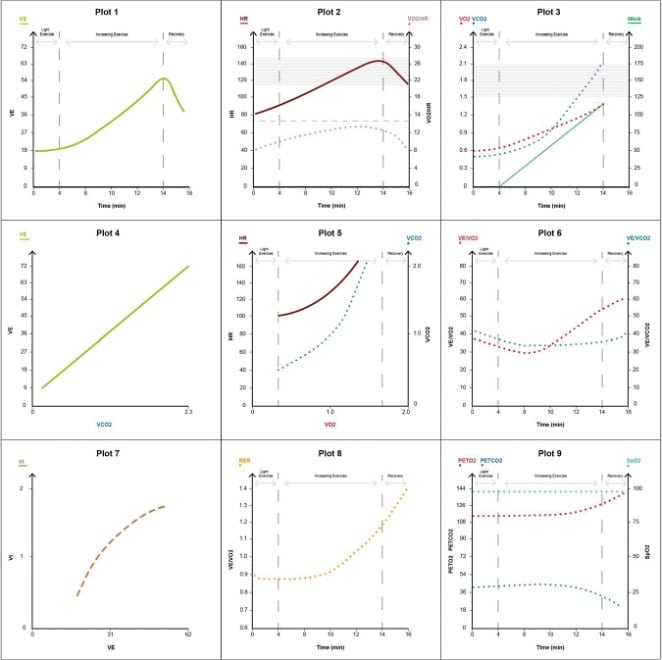
Figure 8. Cardiac limitation pattern.
The key features are as follows (see Figure 8):
- Reduced VO2peak to <80% predicted (relative to age, gender and height) with early-onset AT (plots 3, 6).
- HR may be increased during light exercise as the heart tries to increase its cardiac output without the ability to sufficiently recruit SV (plot 2).
- Peak HR commonly does not reach the age-predicted maximum due to impaired chronotropy from disease or b-blockade, causing a raised HRR (>15%).
- Normal linear increase in minute ventilation up to AT with no ventilatory limitation.
- A higher ventilatory equivalent for CO2 can be a feature where LV failure may cause ‘back up’ or reduced pulmonary flow and worsening of VQ matching (plot 6).
- In severe disease, BP will either not increase normally with exercise or may even fall, requiring immediate abortion of the test.
Respiratory Limitation
Lung disease will result in exercise limitations due to ventilatory failure. Inadequate alveolar ventilation secondary to increased dead space, decreased tidal volumes and loss of alveolar volume causes low O2 saturations and hypercapnia. With chronic obstructive pulmonary disease (COPD), progressive air trapping causes increased end-expiratory lung volume and extreme dyspnoea before the onset of an AT, which isoften not achieved before terminating the test. With restrictive lung disease, the patient is much more reliant on respiratory rate to increase ventilation.
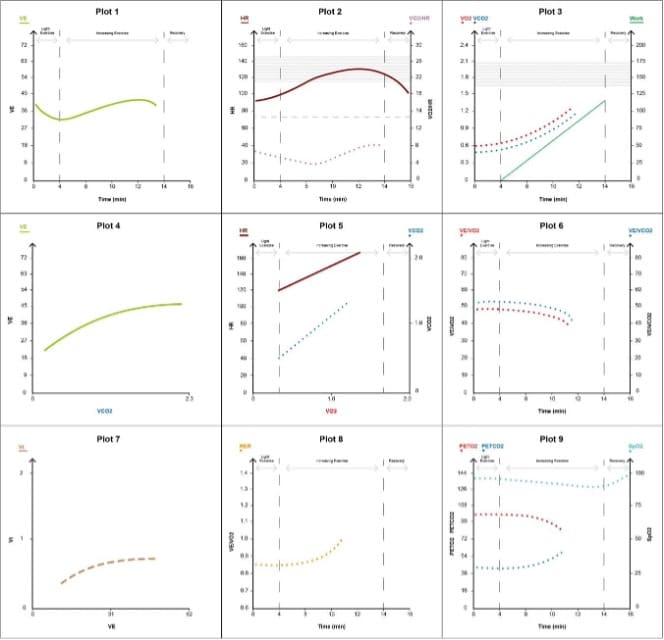
Figure 9. Respiratory limitation pattern.
The key features are as follows (see Figure 9):
- Reduced VO2peak –<80% predicted relative to age, gender and height (plot 3)
- Exhaustion due to ventilatory limitation prior to the onset of AT, so measurement is not achieved (plots 3, 5, 6)
- Elevated VE for VO2 and VCO2 at all work rates (plot 6)
- Decreasing tidal volumes on increasing exercise secondary to air trapping in COPD or restriction in restrictive pathologies (plot 7)
- Low O2 saturations due to VQ mismatch (plot 2)
Pulmonary Vascular Disease
Those with pulmonary vascular disease cannot increase pulmonary blood flow in response to a required rise in cardiac output. This means thatas VE increases with exercise, the dead-space fraction remains abnormally high as the individual ventilates areas of poorly perfused lungtissue. This causes a VQ mismatch. The elimination of CO2 becomes inefficient. Patients tend to have a low alveolar partial pressure of CO2 (PACO2) and partial pressure of end-tidal CO2 (pEtCO2), which decreases further with exercise. (Normally, in the absence of pulmonary vascular disease, the VE/VCO2 falls in the first stages of exercise as the VQ matching improves with better lung perfusion.) An echocardiogram is often subsequently requested to evaluate right heart pressures.
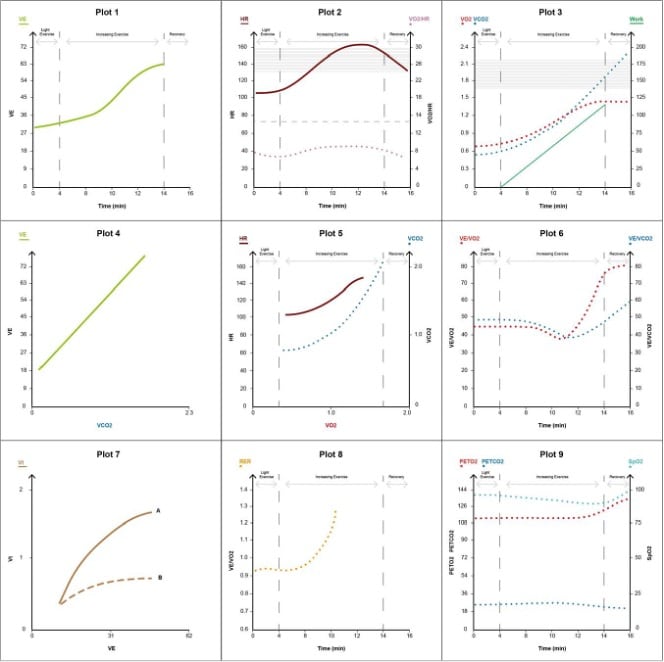
Figure 10. Pulmonary vascular disease pattern (plot 7: A, pulmonary vascular; B, interstitial lung disease).
The key features are the following (see Figure 10):
- Reduced VO2peak to <80% predicted, relative to age, gender and height (plot 3)
- Elevated HR disproportionate to work rate compared with normal individuals (plot 2)
- Desaturation with progressive exercise due to VQ mismatch (SpO2 may be normal at rest; plot 9)
- Low pEtCO2, which falls with exercise (plot 9)
- High VE/VCO2, which rises with unloaded cycling and continues to rise throughout the test due to increased dead space (plot 4)
- Early-onset AT (plots 3, 6)
APPLICATION OF CPET DATA
Studies evaluating the relationship between CPET performance and surgical outcome have found that VO2 peak, AT and VE/VCO2 are predictors of postoperative morbidity and mortality following noncardiac surgery.8,9 The inability to complete the test, whether due topoor mobility, poor physiological reserve or inability to follow instructions, is also associated with an increased risk of postoperative morbidity and mortality.10
Identified physiological limitations may trigger further investigation. For example, a patient with COPD may show a pattern in keeping withcardiac limitation of uncertain cause. An echocardiogram would be required to identify features such as valvular disease and ischaemic cardiomyopathy and for pulmonary artery pressure measurement.
In some centres, CPET data are being used to provide patients with focused prehabilitation programmes.10
Patients with CPET data showing significant limitation are identified as high risk. This raises an opportunity to discuss the risks and benefits of bothsurgical and nonsurgical options. Multidisciplinary discussion is prompted. The patient’s ideas, concerns and expectations are understood, and a mutually agreed treatment plan is made.
Increasingly, CPET is being used to triage patients to intensive care, high-dependency or ward-based care for their postoperative management.A UK case-control study has shown that patients undergoing open colorectal surgery who are assigned as ‘high risk’ with AT <11 mL kg-1 min-1 showed a significantly lower incidence of postoperative major cardiacevents if they were managed in intensive care than those managed on a surgical ward.11
SUMMARY
In an era of an aging and increasingly comorbid population, CPET is a welcome tool that can be used to assist in the complex decision-making process faced by perioperative clinicians and their patients. In providing an objective summary of physiological reserve, it facilitates important discussions about an individual’s perioperative care.
REFERENCES
- Vandam L, Fox Adolf Fick (1929-1901), Physiologist : A Heritage for Anesthesiology and Critical Care Medicine. Anaesthesiology. 1998;88.2:514-518
- Wasserman K, Hansen JE, et al. Wasserman and Whipp’s Principles of Exercise Testing and Interpretation: Including Pathophysiology and Clinical Application. 5th Wolters Kluwer Health / Lippincott Williams & Wilkins; 2012.
- Otto J, Levett DZH, Grocott Cardiopulmonary exercise testing for preoperative evaluation: what does the future hold? Curr Anaesthesiol Rep. 2020;10:1-11.
- Chambers DJ, Wisely Cardiopulmonary exercise testing: a beginner’s guide to the nine-panel plot. Br J Anaesth Educ. 2019;19(5):158-164.
- Levett Perioperative cardiopulmonary exercise testing (CPET): consensus clinical guidelines on indications, organization, conduct, and physiological interpretation. Br J Anaesth. 2018;120(3):484-500.
- Borg Psychophysical bases of perceived exertion. Med Sci Sports Exerc. 1982;14(5):377-381.
- Luks A, Glenny R, Robertson Introduction to Cardiopulmonary Exercise Testing. 1st ed. New York: Springer; 2013.
- Moran J, Wilson F, et al. Role of cardiopulmonary exercise testing as a risk-assessment method in patients undergoing intra-abdominal surgery: a systematic review. Br J Anaesth. 2016;116(2):177-191.
- Swart M, Carlisle JB, Goddard Using predicted 30-day mortality to plan postoperative colorectal surgery care: a cohort study. Br J Anaesth. 2017;118(1):100-104.
- Richardson K, Levett DZH, Jack S, Grocott Fit for surgery? Perspectives on preoperative exercise testing and training. Br J Anaesth. 2017;119:34-43.
- Swart M, Carlisle Case-controlled study of critical care or surgical ward care after elective open colorectal surgery. Br J Surg. 2012;99:295-299.
This work by WFSA is licensed under a Creative Commons Attribution-NonCommercial-NoDerivitives 4.0 International License. To view this license, visit https://creativecommons.org/licenses/by-nc-nd/4.0/