Basic Sciences

SELF-ASSESSMENT QUESTIONS
- What are the main components of an intra-arterial blood pressure measuring system?
- Why should a pressure transducer be positioned at the same level as the patient’s heart?
- What features of an intra-arterial blood pressure measurement system help to reduce errors from excessive damping?
- Why should an intra-arterial blood pressure measurement system have a high natural frequency?
INTRODUCTION
Intra-arterial blood pressure (IABP) measurement is often considered to be the gold standard of blood pressure measurement. Whilst not without risk, it has a number of advantages over non-invasive blood pressure measurement (NIBP):
- it allows continuous beat-to-beat pressure measurement, useful for the close monitoring of patients whose condition may change rapidly, or those who require careful blood pressure control; for example those on vasoactive drugs
- the waveforms produced may be analysed, allowing further information about the patient’s cardiovascular status to be gained (pulse contour analysis)
- it may also be useful where NIBP measurement is difficult e.g. burns or obesity
- it reduces the risk of tissue injury and neuropraxias in patients who will require prolonged blood pressure measurement
- it allows frequent arterial blood sampling
- it is more accurate than NIBP, especially in the extremely hypotensive or the patient with arrhythmias.
This accuracy however, depends on a number of physical principles of the systems used, which we will explore further in this tutorial.
BASIC PRICIPLES
The commonly used IABP measuring systems consist of a column of fluid directly connecting the arterial system to a pressure transducer (hydraulic coupling). The pressure waveform of the arterial pulse is transmitted via the column of fluid, to a pressure transducer where it is converted into an electrical signal. This electrical signal is then processed, amplified and converted into a visual display by a microprocessor.
An understanding of the physical principles involved in these processes is important in order to reduce errors and accurately interpret the waveform displayed.
COMPONENTS OF AN IABP MEASURING SYSTEM
Intra-arterial cannula
The arterial system is accessed using a short, narrow, parallel sided cannula made of polyurethane or Teflon™ to reduce the risk of arterial thrombus formation. Although non-ported venous cannulas can be used, (nonported to reduce the risk of inadvertent injection) there are a number of specially designed arterial cannulas available. The risk of arterial thrombus formation is directly proportional to the diameter of the cannula, hence small-diameter cannulas are used (20-22g), however, this may increase damping in the system (see below). The radial artery is the most commonly used site of insertion as it usually has a good collateral circulation and is easily accessible.
Fluid filled tubing
This is attached to the arterial cannula, and provides a column of non-compressible, bubble free fluid between the arterial blood and the pressure transducer for hydraulic coupling. Ideally, the tubing should be short, wide and non-compliant (stiff) to reduce damping – extra 3-way taps and unnecessary lengths of tubing should be avoided where possible. This tubing should be colour coded or clearly labelled to assist easy recognition and reduce the risk of intra-arterial injection of drugs. A 3-way tap is incorporated to allow the system to be zeroed and blood samples to be taken.
Transducer
Fluid in the tubing is in direct contact with a flexible diaphragm, which in turn moves strain gauges in the pressure transducer, converting the pressure waveform into an electrical signal.
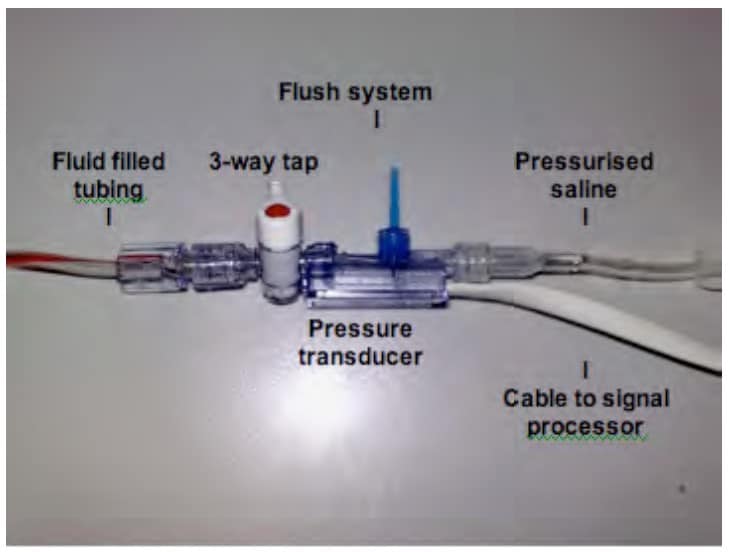
Fig. 1 A typical IABP measuring system
Infusion/flushing system
A bag of either plain 0.9% saline or heparinised 0.9% saline is pressurised to 300mmHg and attached to the fluid filled tubing via a flush system. This allows a slow infusion of fluid at a rate of about 2-4ml/hour to maintain the patency of the cannula. A flush system will also allow a high-pressure flush of fluid through the system in order to check the damping and natural frequency of the system (see below) and to keep the tubing clear.
Signal processor, amplifier and display
The pressure transducer relays its electrical signal via a cable to a microprocessor where it is filtered, amplified, analysed and displayed on a screen as a waveform of pressure vs. time. Beat to beat blood pressure can be seen and further analysis of the pressure waveform can be made, either clinically, looking at the characteristic shape of the waveform, or with more complex systems, using the shape of the waveform to calculate cardiac output and other cardiovascular parameters.
PHYSICAL PRINCIPLES
Sine Waves
A wave is a disturbance that travels through a medium, transferring energy but not matter. One of the simplest waveforms is the sine wave (Fig. 1). These may be thought of as the path of a point travelling round a circle at a constant speed and are defined by the function y = sin x.
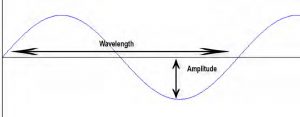
Fig 2. The Sine wave
Sine waves may be described in terms of their amplitude – their maximal displacement from zero, their frequency which is the number of cycles per second (expressed as Hertz or Hz), their wavelength, which is the distance between two points on the wave which have the same value (e.g. two crests or troughs) and their phase, which is the displacement of one wave as compared with another – expressed as degrees from 0 to 360 (see Fig. 2).
Sine waves are of particular importance as any waveform may be produced by combining together sine waves of differing frequency, amplitude and phase. Another way of looking at this is that any complex wave can be broken down into a number of different sine waves.
Fourier Analysis
The arterial waveform is clearly not a simple sine wave as described above, but it can be broken down into a series of many component sine waves. The arterial pressure wave consists of a fundamental wave (the pulse rate) and a series of harmonic waves. These are smaller waves whose frequencies are multiples of the fundamental frequency (e.g. if the fundamental frequency is 1Hz, you would see harmonic waves with frequencies of 2Hz, 3Hz, 4Hz and so on.).
The process of analysing a complex waveform in terms of its constituent sine waves is called Fourier Analysis. Figures 3 & 4 demonstrate how just two sine waves may be combined together to form a more complex wave that begins to resemble the arterial pressure wave.
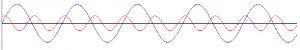
Fig. 3 Two sine waves of differing frequency, amplitude and phase
Becomes:
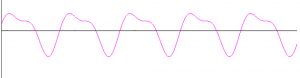
Fig. 4 The sum of the two sine waves above
In the IABP system, the complex waveform is broken down by a microprocessor into its component sine waves, then reconstructed from the fundamental and eight or more harmonic waves of higher frequency to give an accurate representation of the original waveform.
The IABP system must be able to transmit and detect the high frequency components of the arterial waveform (at least 24Hz) in order to represent the arterial pressure wave precisely. This is important to remember when considering the natural frequency of the system.
Natural Frequency & Resonance
Every material has a frequency at which it oscillates freely. This is called its natural frequency. If a force with a similar frequency to the natural frequency is applied to a system, it will begin to oscillate at its maximum amplitude. This phenomenon is known as resonance.
Resonant systems may be very useful. The basilar membrane in the cochlear of the ear is an example of a biological system that works on the principles of natural frequency and resonance. The basilar membrane at the apex of the cochlear has a lower natural frequency than at the base. Sound waves with lower frequencies will therefore cause the basilar membrane to resonate and oscillate maximally at the base of the cochlear, whilst high frequency sound waves will cause the basilar membrane at the base of the cochlear to resonate, allowing the ear to differentiate between sounds of different pitch. However, resonant systems may also be very destructive. In 1850, a suspension bridge in France collapsed when soldiers marching across it in time with the natural frequency of the bridge caused it to resonate. The bridge began to oscillate, swinging wildly as the marching continued until eventually it collapsed.
If the natural frequency of an IABP measuring system lies close to the frequency of any of the sine wave components of the arterial waveform, then the system will resonate, causing excessive amplification, and distortion of the signal. In this case, an erroneously wide pulse pressure and elevated systolic blood pressure would result. It is thus important that the IABP system has a very high natural frequency – at least eight times the fundamental frequency of the arterial waveform (the pulse rate). Therefore, for a system to remain accurate at heart rates of up to 180bpm, its natural frequency must be at least: (180bpm x 8) / 60secs = 24Hz.
The natural frequency of a system is determined by the properties of its components. It may be increased by:
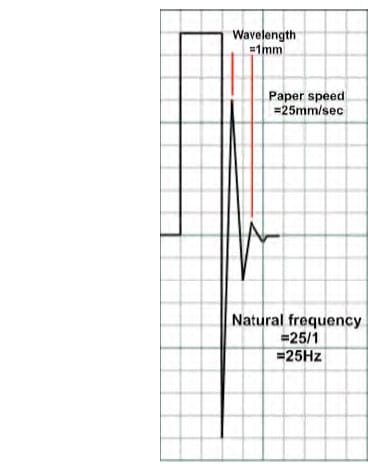
Fig. 5 – Using the fast flush test to measure natural frequency
- Reducing the length of the cannula or tubing
- Reducing the compliance of the cannula or diaphragm
- Reducing the density of the fluid used in the tubing
- Increasing the diameter of the cannula or tubing
Most commercially available systems have a natural frequency of around 200Hz but this is reduced by the addition of three-way taps, bubbles, clots and additional lengths of tubing.
The natural frequency of a system may be measured in the clinical setting using the ‘fast flush’ test (see Fig. 5.). The system is flushed with high-pressure saline via the flush system. This generates an undershoot and overshoot of waves, resonating at the natural frequency of the system. This frequency may be calculated by dividing the paper or screen speed by the wavelength. For example, in Fig. 5, the paper speed is 25mm/sec and the wavelength of the resonant waves is 1mm so the natural frequency is 25/1 = 25Hz – just acceptable.
Damping
Anything that reduces energy in an oscillating system will reduce the amplitude of the oscillations. This is termed damping. Some degree of damping is required in all systems (critical damping), but if excessive (overdamping) or insufficient (underdamping) the output will be adversely effected. In an IABP measuring system, most damping is from friction in the fluid pathway. There are however, a number of other factors that will cause overdamping including:
- Three way taps
- Bubbles and clots
- Vasospasm
- Narrow, long or compliant tubing
- Kinks in the cannula or tubing
These may be a major source of error, causing an under-reading of systolic blood pressure (SBP) and overreading of diastolic blood pressure (DBP) although the mean blood pressure is relatively unaffected.
Damping also causes a reduction in the natural frequency of the system, allowing resonance and distortion of the signal as discussed above.
Whilst care must be taken to avoid overdamping, underdamping may also pose problems. In an underdamped system, one sees an overshoot of the pressure waves – with excessively high SBP and low DBP, as in a resonant signal. A compromise between over and under-damping must be therefore be found.
If a brief burst of energy is applied to a critically damped system, for example quickly flushing an IABP system, after displacement, the wave returns to the baseline, without any overshoot. Critical damping is therefore defined as the minimal amount of damping required to prevent any overshoot. The damping co-efficient in a critically damped system is 1. However, this does result in a system that is relatively slow to respond.
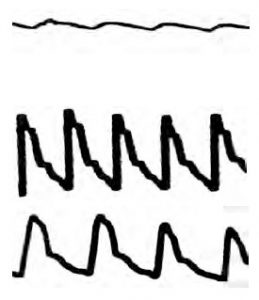
This is a trace from an overdamped IABP system. The damping coefficient is >1. This system will not oscillate freely and detail such as the dichrotic notch will be lost. It will not overshoot but will tend to under-read SBP and over-read DBP. It will be slow to respond to change due to the frictional drag in the system.
This is a trace from an underdamped IABP system. The damping coefficient is <0.7. This system will be quick to respond but will tend to overshoot and oscillate around its resting point, over-reading SBP and under-reading DBP.
This is a trace from an optimally damped system. The damping co-efficient will be around 0.7, which provides the best balance between speed of response and accuracy.
The damping co-efficient of a system can also be measured clinically using the fast flush test (see Fig. 6). Following a system flush, the amplitude ratio of two consecutive resonant waves are calculated by dividing the smaller ratio by the larger. The respective damping co-efficient is then taken from the chart shown. In the example shown, the amplitude ratio is 0.31 (2.5/8), giving a damping co-efficient of 0.36, meaning that this system is underdamped.
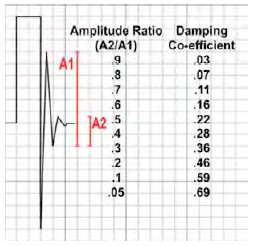
Fig 6. Using the fast flush to calculate damping co-efficient
Transducers
A transducer is any device that converts energy from one form into another and are usually used for measurement or monitoring. However, a microphone is also a transducer as it converts sound energy into electrical energy!
Pressure transducers are used in IABP systems. These convert the arterial pressure waveform into an electrical signal that can then be measured, processed and displayed.
The arterial pulse pressure is transmitted via the column of fluid in the tubing to a flexible diaphragm, displacing it. This displacement can then be measured in a number if different ways. The commonest method is with a strain gauge. Strain gauges are based on the principle that the electrical resistance of wire or silicone increases with increasing stretch. The flexible diagram is attached to wire or silicone strain gauges and then incorporated into a Wheatstone bridge circuit (see below) in such a way that with movement of the diaphragm the gauges are stretched or compressed, altering their resistance.
Strain gauges have now evolved into such tiny devices that they can be used within cannula tips – such as in some ICP monitors. These systems are, however, prone to fibrin deposition and baseline drift. They cannot be calibrated after insertion and so become less accurate with time.
The Wheatstone Bridge
The Wheatstone bridge is a circuit designed to measure unknown electrical resistance.
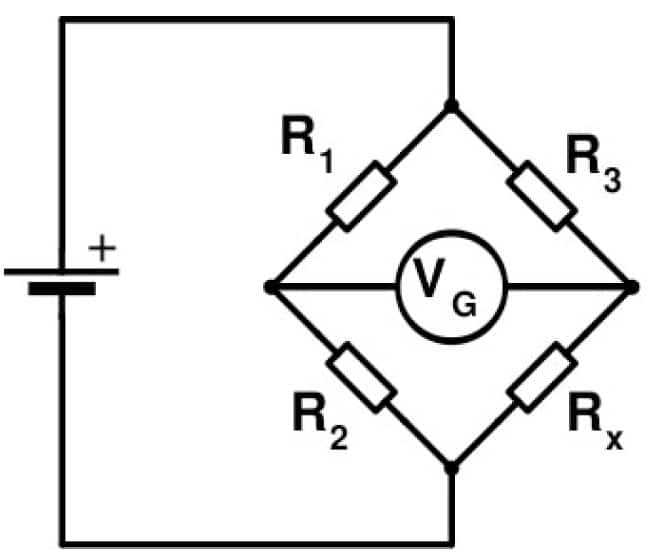
Fig.7 The Wheatstone bridge circuit. When (R2/R1=R3/Rx), the bridge will be balanced and no potential difference will be measured by the galvanometer.
Classically, these were arranged with three resistors of known resistance and one of variable resistance (the strain gauge). When the ratio of the resistors on the known side of the circuit (R2/R1) equals the ratio on the other side of the circuit (R3/Rx) the bridge is balanced, no current will flow and no potential difference will be measured by the galvanometer (VG). When the resistance of the strain gauge (Rx) changes due to pressure applied to the attached diaphragm, the two sides of the bridge become unbalanced and a current flows. The resulting potential difference is measured by the galvanometer and is proportional to the magnitude of the pressure applied.
Newer Wheatstone bridge setups use strain gauges in all four positions. The diaphragm is attached in such a way that when pressure is applied to it, gauges on one side of the Wheatstone bridge become compressed, reducing their resistance, whilst the gauges on the other side are stretched, increasing their resistance. The bridge then becomes unbalanced and the potential difference generated is proportional to the pressure applied. This setup of four strain gauges has the advantage that it is four times more sensitive than a single gauge Wheatstone bridge. It also compensates for any temperature change as all of the strain gauges are affected equally (temperature will affect the resistance of a strain gauge so in the single gauge setup, a change in temperature will skew readings).
Levelling and zeroing
Zeroing
For a pressure transducer to read accurately, atmospheric pressure must be discounted from the pressure measurement. This is done by exposing the transducer to atmospheric pressure and calibrating the pressure reading to zero. Note that at this point, the level of the transducer is not important. A transducer should be zeroed several times per day to eliminate any baseline drift.
Levelling
The pressure transducer must be set at the appropriate level in relation to the patient in order to measure blood pressure correctly. This is usually taken to be level with the patient’s heart, at the 4th intercostal space, in the mid-axillary line. Failure to do this results in an error due to hydrostatic pressure (the pressure exerted by a column of fluid – in this case, blood) being measured in addition to blood pressure. This can be significant – every 10cm error in levelling will result in a 7.4mmHg error in the pressure measured; a transducer too low over reads, a transducer too high under reads.
SUMMARY
Invasive arterial blood pressure measurement is an extremely useful clinical tool, offering beat-to-beat blood pressure measurement and a visible waveform, allowing a more detailed analysis of the patient’s cardiovascular status to be made. However, an awareness and understanding of the common sources of error – primarily resonance, damping and errors of zeroing and levelling – and how to detect and prevent these errors is important to ensure an accurate and useful measurement is made.
FURTHER READING
Magee P, Tooley M. The physics, clinical measurement and equipment of anaesthetic practice. Oxford University Press 2005
Ward M, Langton J. Blood Pressure Measurement. Continuing Education in Anaesthesia, Critical care and Pain2007 Vol 7(4): 122-126
Stoker M. Principle of pressure transducers, resonance, damping and frequency response. Anaesthesia and Intensive Care Medicine 2004 5(11): 371-375
Gupta B. Invasive blood pressure monitoring. World Anaesthesia Society, Update 23. http://worldanaesthesia.org/index.php?option=com_docman&task=doc_download&gid=210&Itemid=26
ANSWERS TO QUESTIONS
- What are the main components of an arterial blood pressure measuring system?
- Intra-arterial cannula
- Fluid filled tubing
- Pressure transducer
- Pressurised flushing system
- Microprocessor and display
- Why should a pressure transducer be positioned at the same level as the patient’s heart?
- To avoid introducing error by reading hydrostatic pressure (the pressure exerted by a column of fluid) in addition to blood pressure. For every 10cm the transducer is below the heart, the system will overread by 7.4mmHg (and will under-read by the same amount if the transducer is above the heart)
- What features of an arterial blood pressure measurement system help to reduce errors from excessive damping?
- The cannula and tubing should be short, non-compliant and kink free. The fluid within the tubing should be non-compressible and of low density. 0.9% saline or heparinised saline is usually used, and it must be free of bubbles and clots. 3-way taps and extra lengths of tubing should be kept to a minimum.
- The flush system should be pressurised to 300mmHg to allow an infusion at 2-4ml/hr to reduce thrombus formation and also to allow the ‘fast flush test’ (see text) to be performed.
- The waveform should also be displayed so that the waveform changes associated with excessive damping may be quickly detected and appropriate alterations made to the system.
- Why should an intra-arterial blood pressure measurement system have a high natural
frequency?- The arterial waveform consists of a fundamental wave and at least eight harmonic waves of increasing frequency. Should any of those waves oscillate at a similar frequency to the natural frequency of the measuring system, resonance will occur, resulting in inappropriate amplification of the waves, distorting any readings.
- For this reason a system should have a natural frequency which is greater than eight times the maximal anticipated heart rate.
This work by WFSA is licensed under a Creative Commons Attribution-NonCommercial-NoDerivitives 4.0 International License. To view this license, visit https://creativecommons.org/licenses/by-nc-nd/4.0/