Paediatric Anaesthesia

QUESTIONS
Before continuing, try to answer the following questions. The answers can be found at the end of the article, together with an explanation.
- The oxyhaemoglobin dissociation curve is shifted to the left by:
- an increase in arterial PCO2
- acidosis
- a decrease in 2,3 DPG
- carbon monoxide
- a fall in temperature
- Anatomy of the respiratory tract
- the alveoli humidify gas
- generations 1- 18 are known as the conducting zone of the lungs
- there are 25 bronchial generations
- bifurication of the bronchi occurs at T4
- the lungs are lined with transistional epithelium
- Dead space
- is defined as the volume of gas which does take part in gas exchange
- physiological dead space is the same as alveolar dead space
- anatomical dead space is measured by the Bohr equation
- dead space is usually about 45% of tidal volume
- occurs with pneumonia
- Pulmonary vascular resistance
- is high at high lung volumes
- is low at low lung volumes
- can cause heart failure
- is calculated using PCWP
- is decreased by nitrous oxide
- Diffusion of gases
- is increased with a decrease in surface area
- is indirectly proportional to the concentration gradient
- is not governed by Grahams law
- is directly proportional to the thickness
- is decreased according to Beers law
- Gas transport in the blood
- there is about 15ml of oxygen per 100ml of oxygenated blood
- oxygen CO2 is mainly tranported as carbamino compounds
- CO2 is carried best by oxygenated haemoglobin
- More oxygen is carried dissolved in blood than CO2
- CO2 is transported in the blood by 3 main routes
PERFUSION OF THE LUNG
Blood flow to and around the lung is similar to any other organ but at much lower pressures than the systemic system (see diagram). The blood vessels in the lungs continually branch and get consistently smaller very like the branching of the airways. The pulmonary arteries whose walls are very thin in comparison to that of the arteries in the main circulation feed the lung up to the level of the terminal bronchioles and then split into the capillary bed. The capillaries have great capability to distend thus enhancing gas exchange and reservoir action. Once the red blood cells have become oxygenated the capillary bed is drained into venules which then join to form the pulmonary veins. It is the ability of the blood vessels to distend and be recruited which allows the pressures in the pulmonary system to stay low despite very high blood flow.
The pulmonary arteries only supply blood flow and oxygen to the lungs and must have the ability to accept huge blood volumes at times. The low pulmonary pressures are important to minimise the work of the right heart.
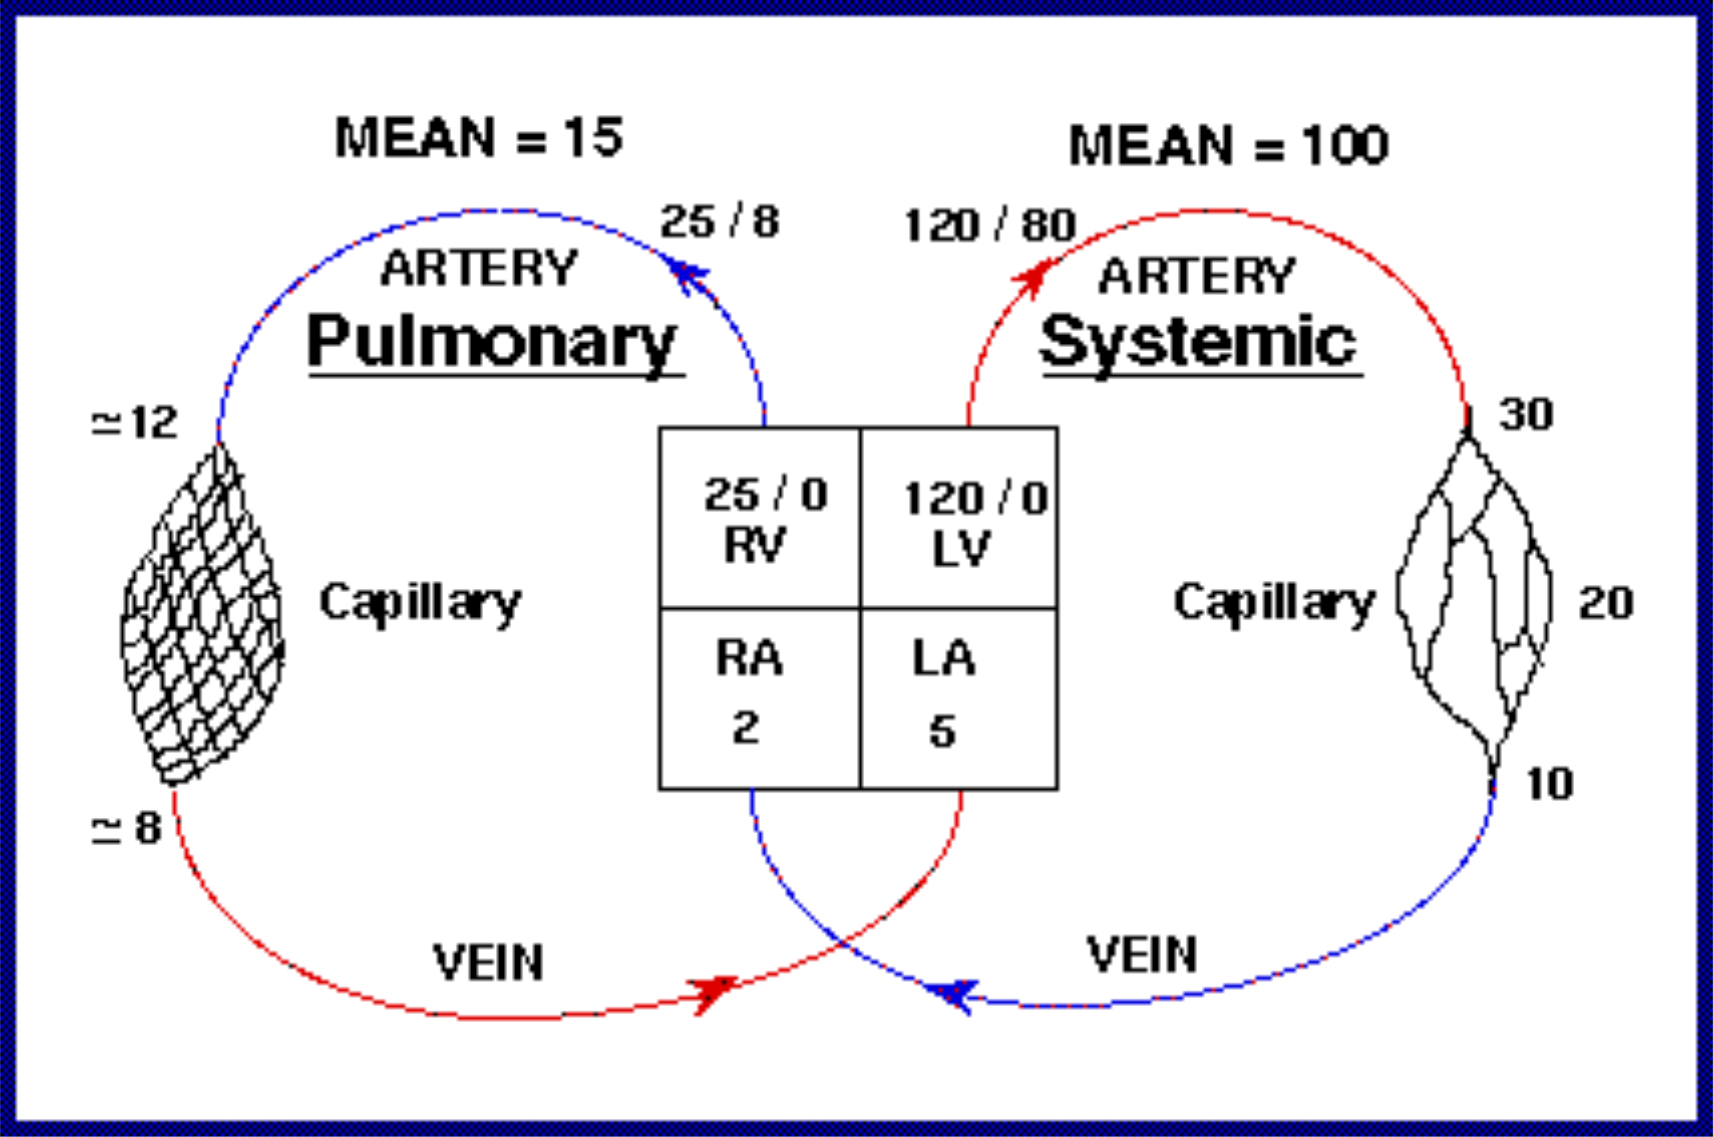
Figure 6: The pressures within the main and pulmonary circulatory systems
PULMONARY VASCULAR RESISTANCE
PVR = 80 x (MPAP – PCWP ) / CO
Acute and chronic lung disease
Both can cause an increase in PVR. Chronic PVR can lead to right sided heart failure
Lung volumes
PVR depend on the alveolar and extra-alveolar resistances. Both low and high lung volumes will increase PVR, it is at its lowest at FRC.
Alveolar vessels or pulmonary capillaries will become overly stretched longitudinally at high lung volumes and therefore their resistance will increase.
With extra – alveolar vessels resistance will increase at low lung volumes since they are not encouraged to expand by lung parenchyma.
PVR can also be altered through the distension and recruitment of pulmonary vessels which have a large ability to increase their capacitance.
Hypoxic pulmonary vasoconstriction
In response to episodes of low partial pressure of alveolar oxygen the lung will divert its own blood supply to areas of properly ventilated lung tissue. This is important in matching and maintaining ventilation to perfusion in the lung. HPV is also obtunded by the general anaesthetic inhalational agents, it is relatively preserved by TIVA.
Metabolic substances
Endothelin – released from the lung endothelial cells in response to tissue damage – is a very potent vasoconstrictor
Prostacyclin – a naturally occurring vasodilator
Nitric oxide – Also known as endothelin derived relaxing factor – a potent vasodilator
Perfusion throughout the lungs
Taking all of the above into account it is easy to understand then why blood flow is not always even throughout the lung. Gravity plays a large part in directing blood flow by setting up a hydrostatic pressure gradient which is higher at the base of the lung than at the top. Blood is preferentially directed to the lung bases.
As well as the affect of gravity on perfusion and ventilation, the differing pressures within the alveoli, arteries and venous systems heavily influences the outcome. The relationship between these factors describes West zones.
West zones within the lung are 3 vertically split zones (in the upright subject) which explain how alveoli, arterial and venous pressures differ in each zone and thus affect perfusion and ventilation throughout the lung.
In zone 1 the alveolar pressure may exceed that of the arterial and venous pressure and thus little perfusion will occur as the vessels collapse, this then leads to dead space.
In zone 2 the arterial pressure will exceed that of the alveoli pressure but not the venous pressure.
In zone 3 both the arterial and venous pressures exceed the alveoli pressure.
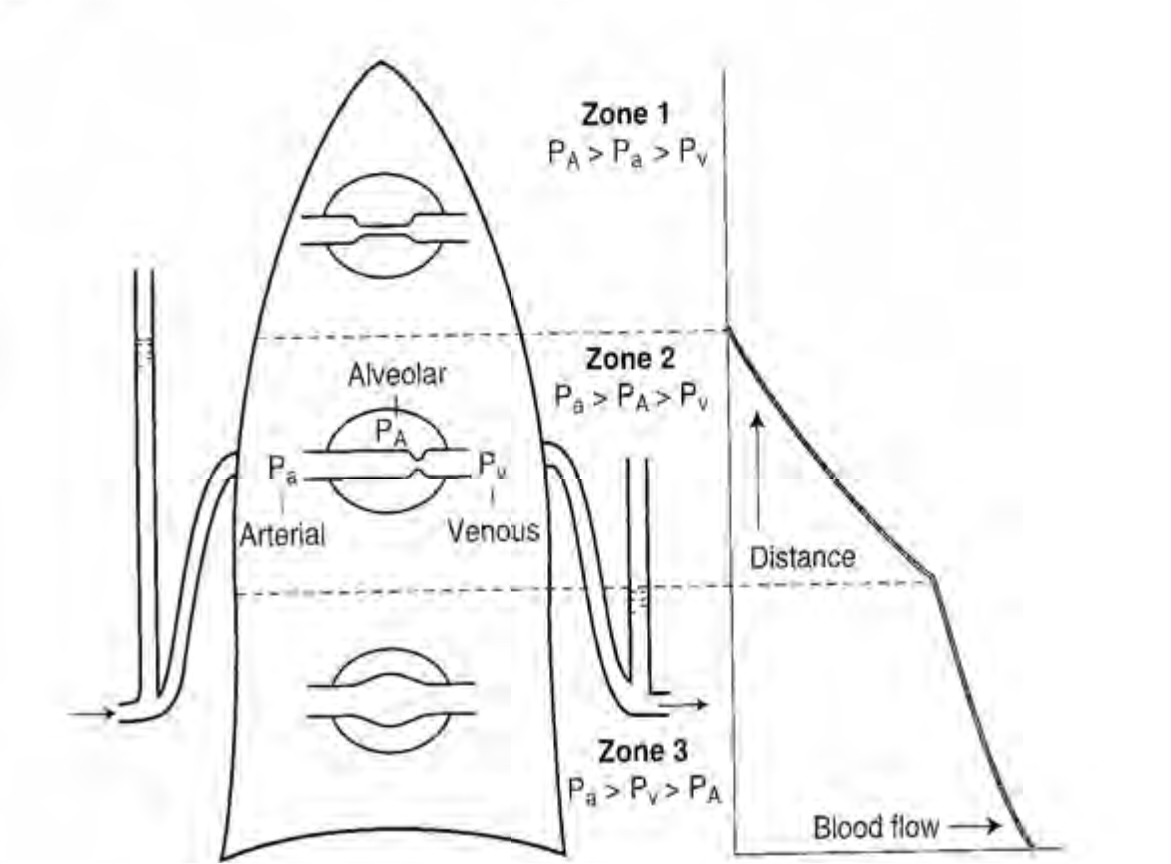
Figure 7: West Zones
Key points
- The lung is a low pressure system
- Low pulmonary pressure minimises the work of the right heart
- The pulmonary vessels distend and recruit to maintain low pressures
- Very high and very low lung volumes increase pulmonary vascular resistance
- Hypoxic pulmonary vasoconstriction diverts blood flow away from poorly ventilated regions of lung
- HPV is obtunded by anaesthesia
Clinical points
- Ventilatory stategies can prevent increases in pulmonary pressures e.g low tidal volumes, permissive hypercapnia
- TIVA does not affect HPV
GAS EXCHANGE
The partial pressure of oxygen that is inhaled from our natural environment through normal inhalation is not maintained at the same partial pressure by the time it reaches the alveoli and indeed the mitochondria. The process by which this decrease in partial pressure occurs is called the oxygen cascade.
- The air surrounding us – how much oxygen does it contain?
- Dry atmospheric air gas – 21% of 100KPa
- Therefore 21 KPa or 160mmmg
However as gas is inspired it is diluted by water vapour which reduces the partial pressure of oxygen Water vapour – 6.3 KPa/ 47mmHg
- PO2 = 0.21 x (760-47)= 149mmHg
- PO2 = 0.21 x (100-6.3) = 19.8KPa
When the gas reaches the alveoli the partial pressure of oxygen will again decrease as some oxygen is absorbed and CO2 is excreted. The partial pressure at this point in the oxygen cascade can be determined by using the alveolar gas equation.
- PAO2 = PIO2 – PACO2/RQ
The RQ stands for respiratory quotient and is normally 0.8. It is determined by the amount of CO2 produced/oxygen consumed.
- PAO2 = 0.21- 5/0.8 = 14KPa (106mmHg)
Again when the gas reaches the arterial blood a further small drop in partial pressure will have occurred as blood known as venous admixture with a lower oxygen content mixes with the oxygenated alveolar blood.
Venous admixture is made up of blood that has passed through poorly ventilated regions of lung and thus has a lower O2 partial pressure. Venous admixture is also composed of venous blood which has drained the lungs and left side of the heart. This blood is known as true shunt and drains directly into the left side of the heart.
Extraction of oxygen from this blood then causes the end capillary oxygen partial pressure to be 6-7KPa (40 – 50mmHg)
In the mitochondria the PO2 varies hugely from 1-5KPa (7.5-40mmHg) This provides us with an explanation for the following graph, the oxygen casade.
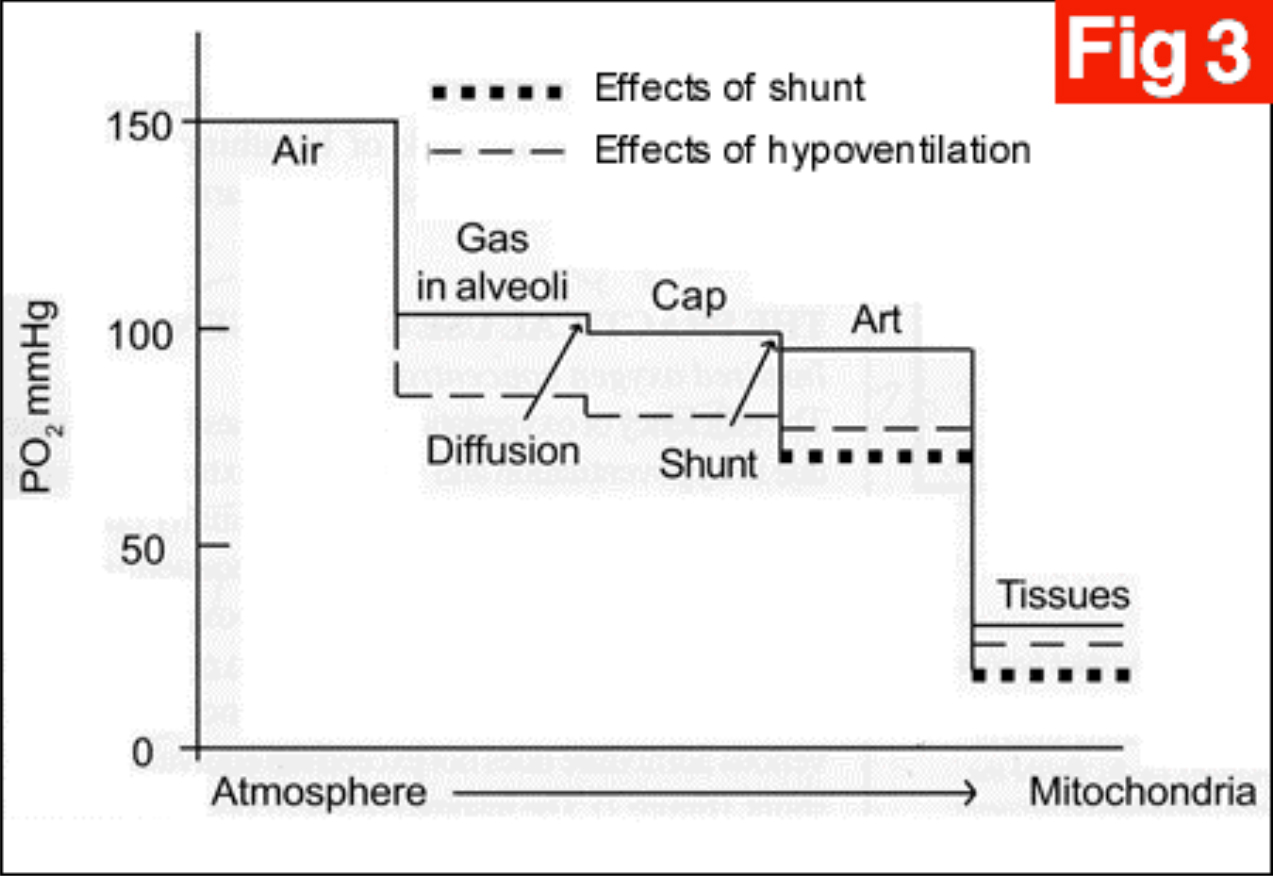
Figure 8: Diffusion of gases from alveoli to blood – the oxygen cascade
Diffusion of Gases Across the Alveolar Membrane
The speed and ease of diffusion are controlled by the laws of diffusion.
Fick’s law of diffusion states that gas transfer across a membrane is directly proportional to the concentration gradient.
Graham’s law states that diffusion of a gas is inversely proportional to the square root of the molecular weight of the molecule.
Other factors which increase diffusion:
- Large surface area
- Thin membrane
- High solubility
The following equation incorporates the important factors
Diffusion is proportional to A/T. D. (P1 –P2)
- A = Area
- T = Thickness
- D = Diffusion constant
- P1 – P2 = Concentration gradient
Diffusion in the lungs can be limited in the presence of disease states e.g pulmonary oedema and thickening of the alveolar membrane in pulmonary fibrosis.
Oxygen transport
Oxygen is carried in 2 forms in the blood:
- Oxygen combined to haemoglobin (97%)
Haemoglobin molecule consists of 2 alpha and 2 beta chains; each chain is formed from an iron–porphyrin molecule – haem. Each haemoglobin molecule can bind 4 oxygen molecules (20ml oxygen per 100ml blood) or 15ml oxygen per 100ml in venous blood
- Oxygen dissolved in the blood – this accounts for a minimal amount (0.3ml per dl) The amount dissolved obeys Henrys’ law – amount is proportional to the partial pressure 0.023ml per KPa per 100ml blood
Oxygen content in the blood
Total content of oxygen in the blood can be calculated from the Oxygen flux equation:
Flux = (CO X Hb x Saturation X Huffners constant(1.39)) + (0.023 X PO2)
Oxygen dissociation curve
- Sigmoid shaped curve relating the fact that binding of oxygen to the heamoglobin molecule is a cooperative process
- Describes the relationship of saturation of haemoglobin with oxygen at varying partial pressures
- Be aware of the P50 –(point at which Hb is 50% saturated)
- Decreasing pH, increasing temperature, 2,3-DPG and CO2 tension will cause a right shift of the curve
- Increased pH, and reduction in CO2 tension, temperature and 2,3-DPG produce a left shift of the curve
- If a right shift occurs the Hb molecule is more likely to offload oxygen to the tissues
- In a left shifted situation the Hb is less likely to release oxygen to the tissues
Haemoglobin Oxygen dissociation curve
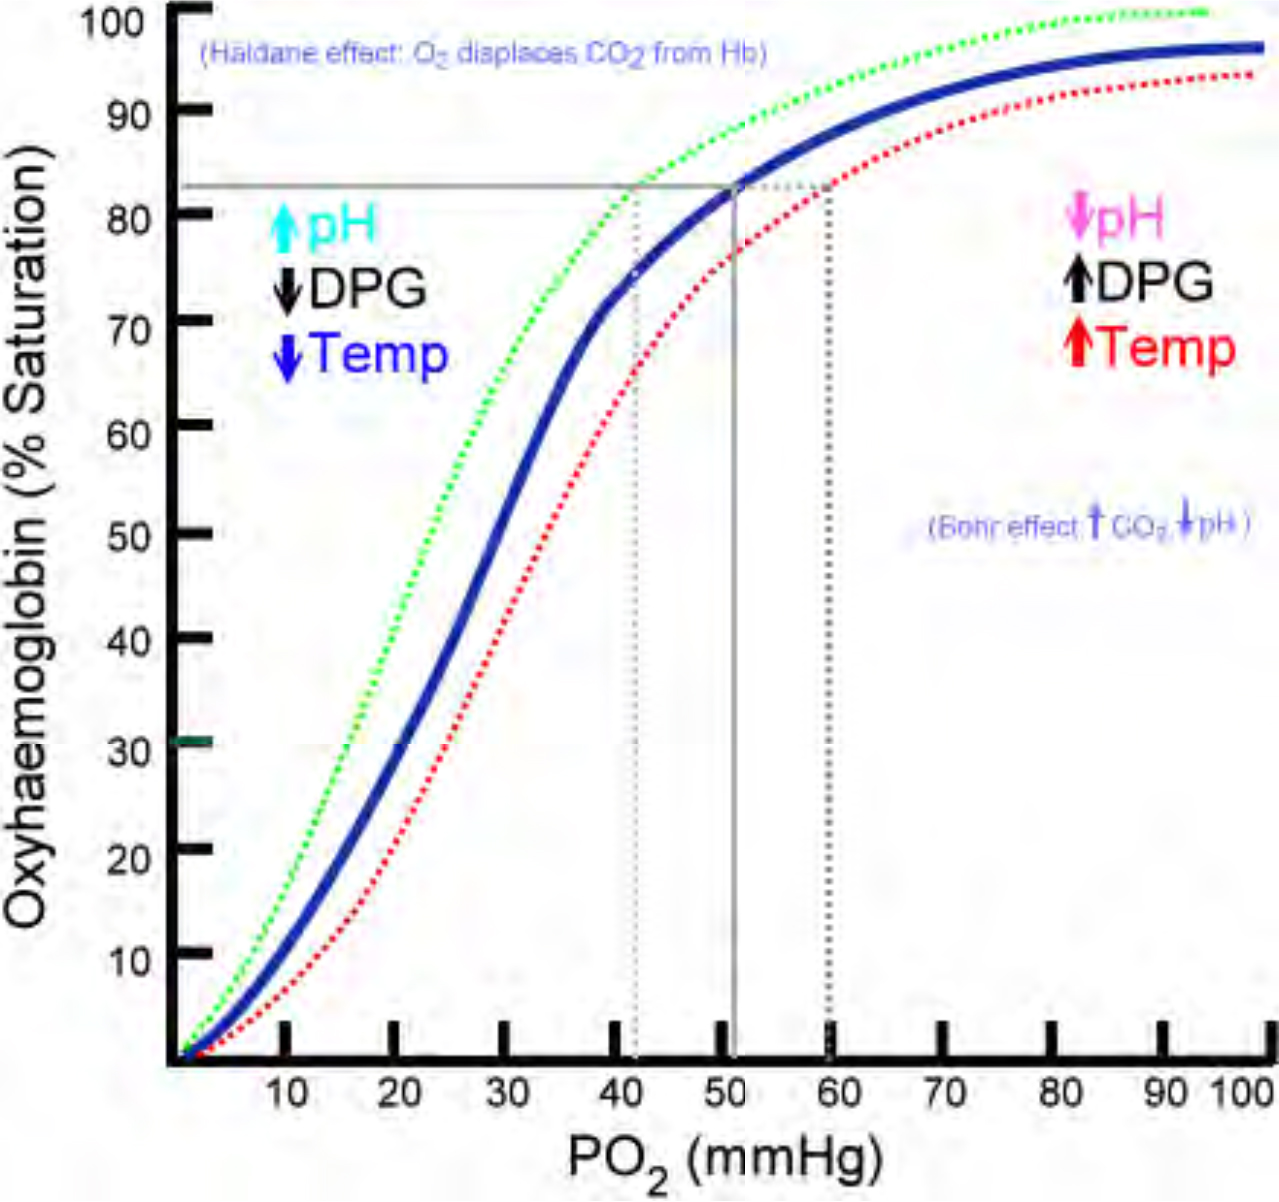
FIGURE 9: The Oxyhaemoglobin dissociation curve
2,3-DPG
This molecule binds to deoxygenated Hb – it reduces the affinity of haemoglobin for oxygen and therefore ensures offloading of oxygen to the tissues.
The Bohr Effect
This describes the affect that CO2 has on influencing the release of oxygen to the tissues. On entering red blood cells the following reaction occurs:
- CO2 + H2O ↔ H2CO3 ↔ H+ + HCO3–
An increase in H+ will cause an acidosis and therefore encourage the release of oxygen from Hb. In the lungs where the CO2 is being removed, the alkalosis will encourage the uptake of oxygen.
Oxygen Delivery (DO2)
This can be calculated as follows:
- Cardiac output X arterial O2 content
Carbon dioxide transport
Carbon dioxide is carried in the blood in 3 ways:
- As bicarbonate – 90%
- As dissolved CO2 – 5%
- As carbamino compounds – 5%
Carbamino compounds are formed by the reaction of the CO2 with terminal amino groups of proteins and side chains of arginine and lysine. Haemoglobin is essential for this process to occur since it has 4 amino groups per molecule. Albumin also provides amino groups but only 1 per molecule.
The Haldane effect
This phenonomen refers to the increased ability of blood to carry CO2 when haemoglobin is deoxygenated. Deoxyhaemoglobin is 3.5 times more effective than oxyhaemaglobin in forming carbamino compounds.
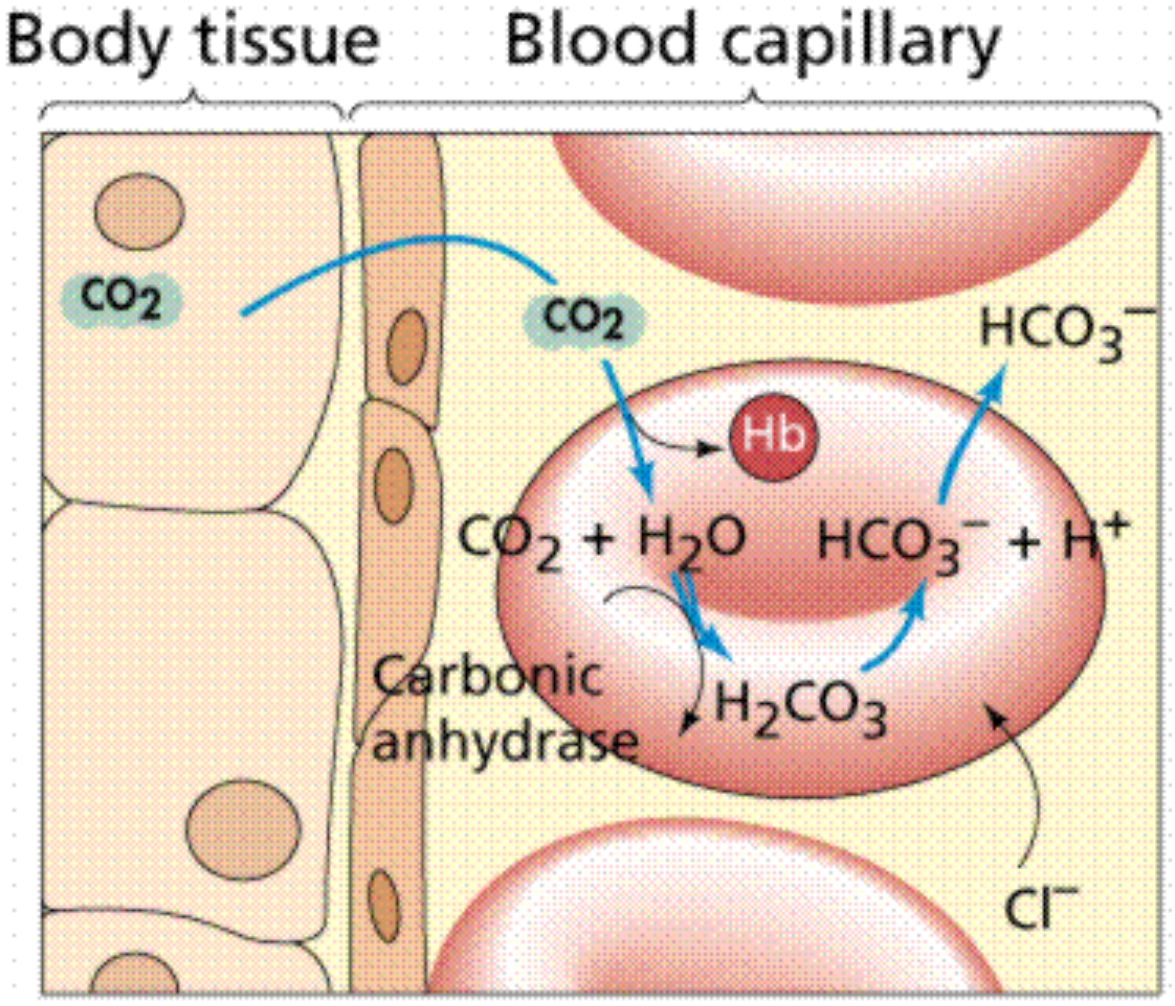
Figure 10: Carbon dioxide transport in blood
Ventilation perfusion Relationships
As mentioned earlier any discrepancy between ventilation and blood flow in the lung will result in V/Q mismatch and potentially dangerous irregularities in gas exchange. If flow of blood to the lung units is to match that of ventilation to the same unit then the ratio of ventilation to perfusion should be in a ratio of 1:1
If the lung is being underventilated but perfused as normal then we say that the V/Q ratio is <1 If the lung is under perfused then the V/Q is >1
Even in a normal lung the V/Q ratio is not uniformly 1 throughout the lung as perfusion and ventilation both have favoured parts of the lung.
Differences between the apices and bases of the lungs
At the apices there is less ventilation than the bases as alveoli are already very stretched however there is proportionally less perfusion therefore the overall V/Q ratio is higher compared to the base of the lung.
Blood flow is directly affected by gravity and naturally has a tendency to flow to the bases of the lungs thus V/Q ratios towards the lower segments of the lung are usually greater than 1.
The vertical change in V/Q ratios in the lung is because although both ventilation and perfusion increase from top to bottom of the lung, perfusion increases much quicker than ventilation. Thus the V/Q ratio at the top of the lung is 3.3 whereas at the bases it is around 0.6. See the following illustration (figure 11).
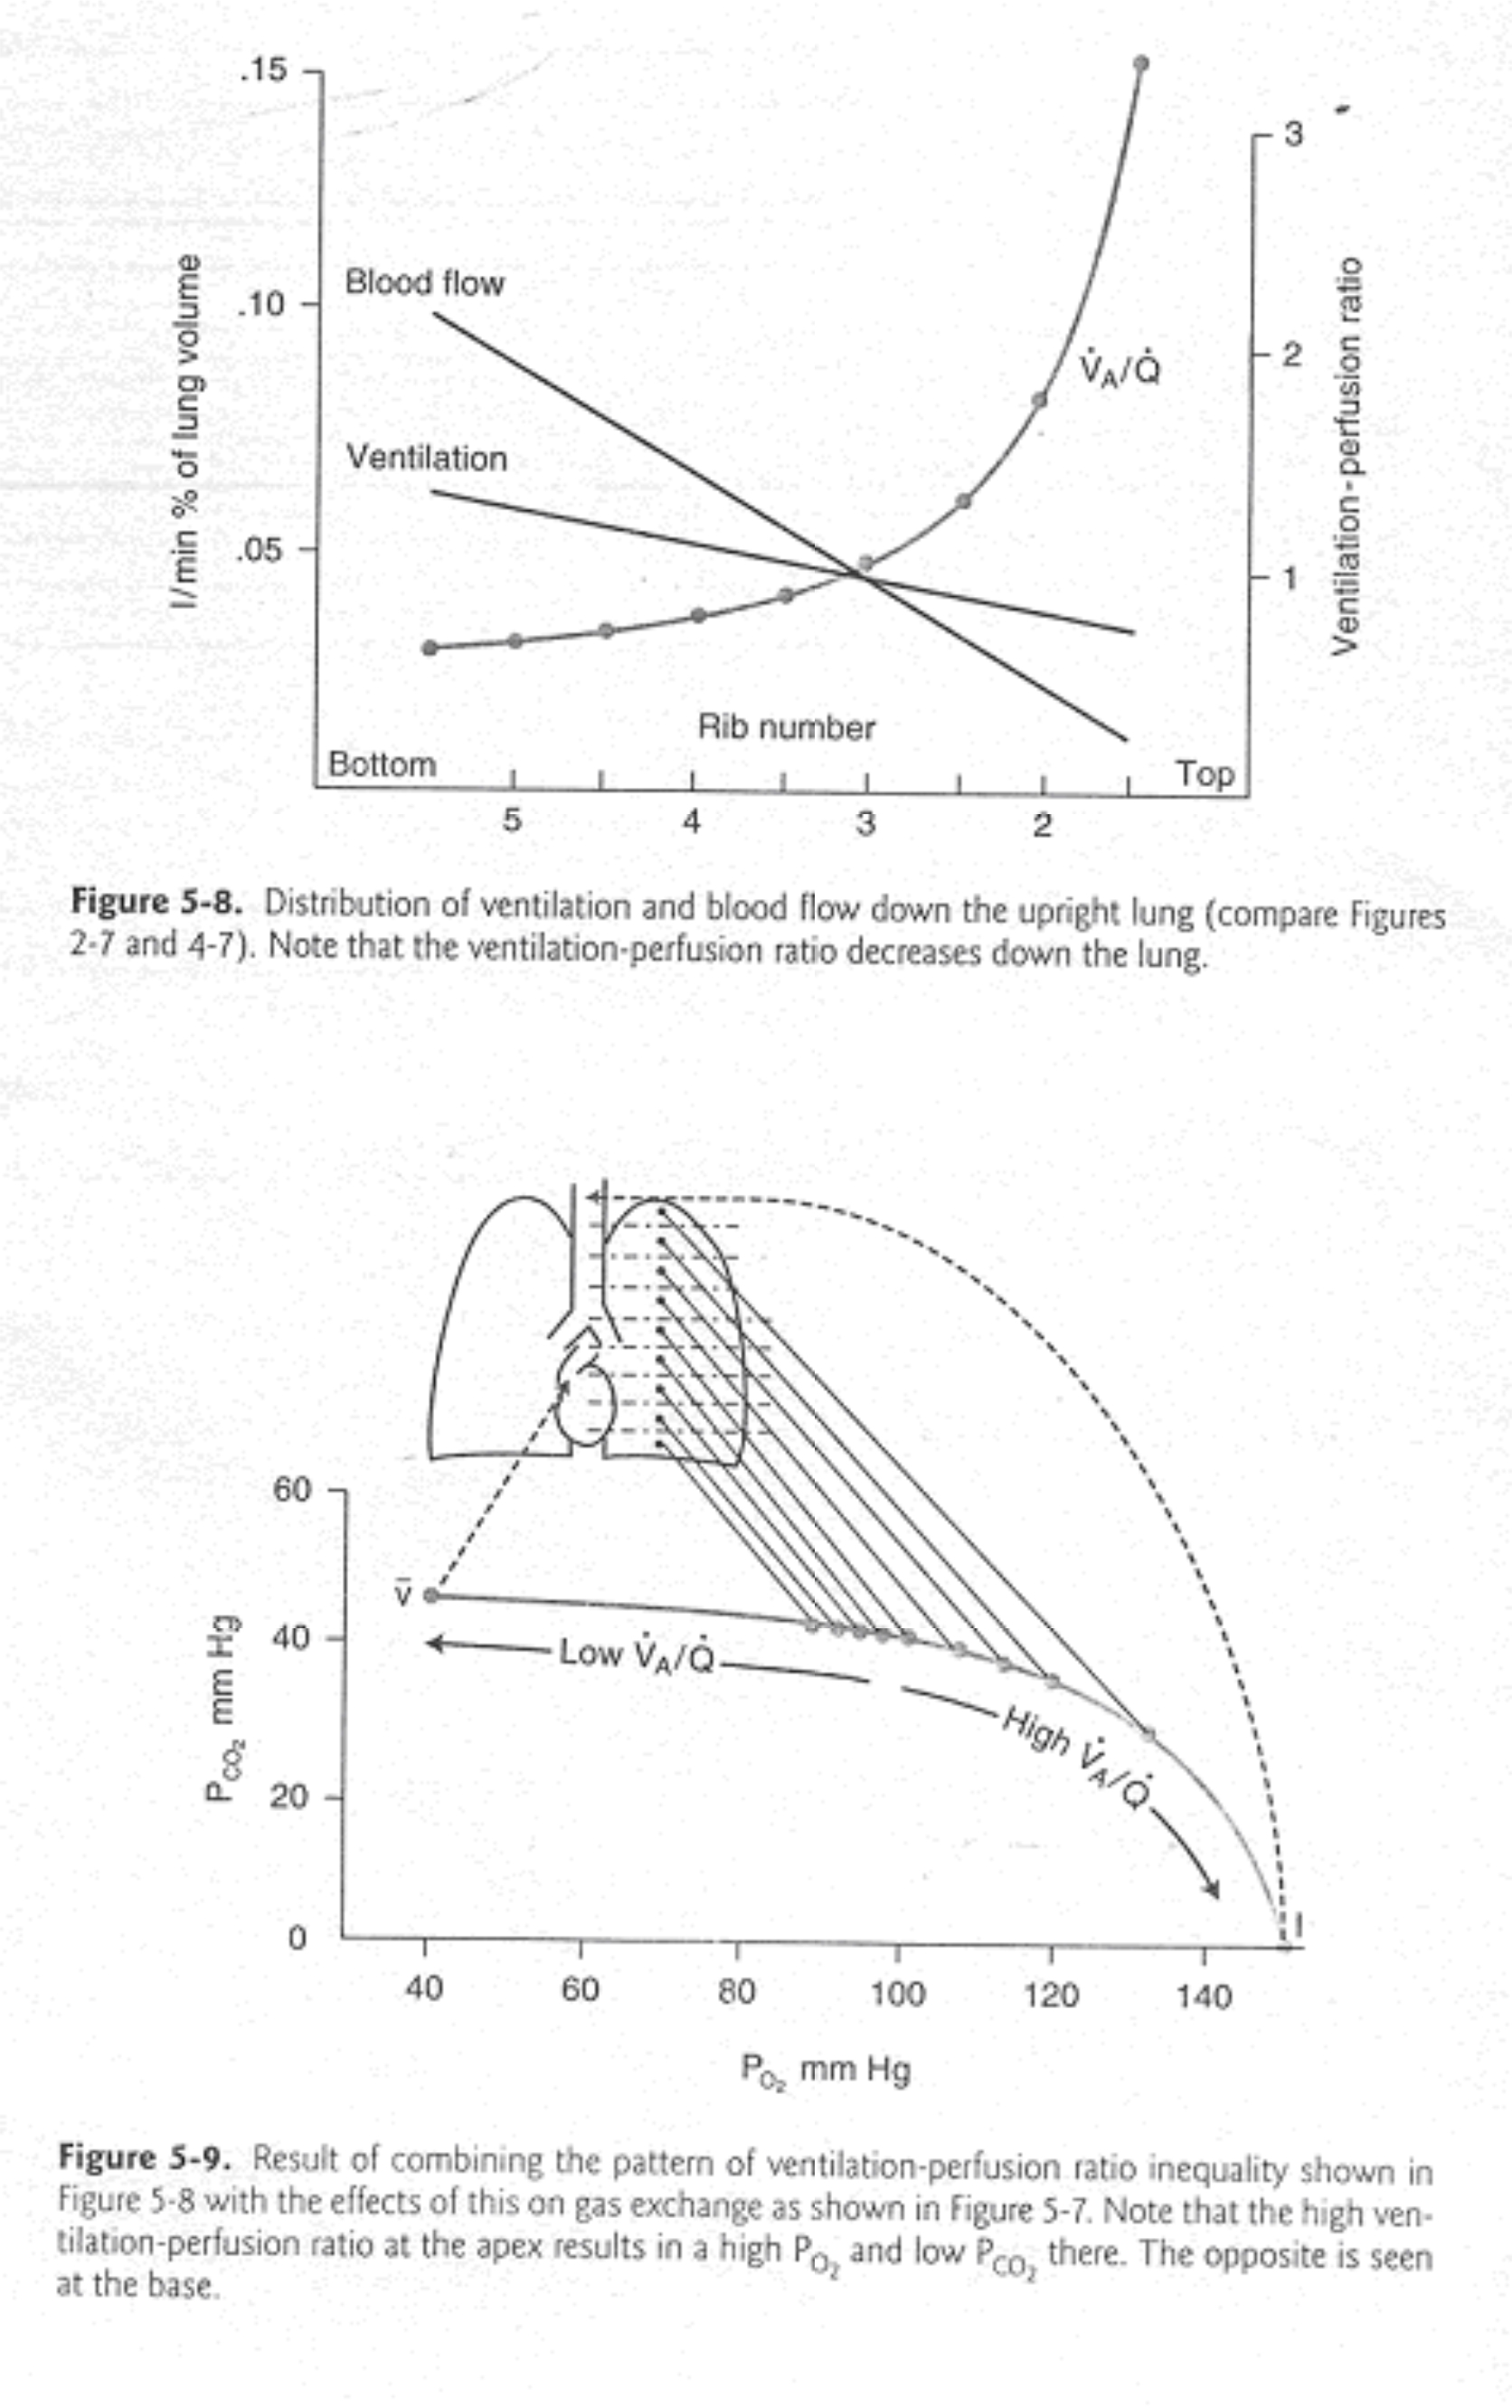
Figure 11: Ventilation perfusion relationships in the lungs
Alveolar –Arterial P02 gradient
The value for the A-a gradient gives the clinician some idea about the amount of VQ mismatch and shunt that is present in the lungs. A typical normal value would be around 0.5-1 KPa (5mmHg) though values up to around 15mmHg may be accepted.
It is calculated as PAO2 – PaO2. The PAO2 is calculated using the alveolar gas equation.
Shunt
True shunt refers to a VQ = 0. That is to say that blood has passed through areas of the lung where no ventilation is occurring. As discussed earlier VQ mismatch is also referred to as shunt. Blood passes through areas of the lung which are poorly ventilated ie VQ<1.
Physiological shunt refers to the amount of venous admixture which is directly added to main circulatory blood without having passed through the oxygenating mechanism of the lung. Blood from the bronchial veins draining the lung parenchyma and the thebesian veins draining the cardiac muscle represent the physiological shunt (around 5% of cardiac output.)
The shunt equation allows calculation of the amount of shunt present in an individual subject
The Shunt Equation:
- Qs = Shunted blood flow
- Qt = Cardiac output
- Qt-Qs = Blood flow through the lungs minus the shunted blood
- CcO2 = Oxygen content of end pulmonary capillary blood
- CaO2 = Oxygen content of arterial blood
- CvO2 = Oxygen content of mixed venous blood

Figure 12: A visualization of the shunt equation
The amount of oxygen leaving the lungs is Qt x CaO2. This is equal to the shunted blood flow plus the oxygen content from the lung which would be
- (Qs x CvO2) + (Qt-Qs) x CcO2. (shunt flow x mixed venous O2 content + pulmonary capillary flow x pulmonary capillary O2 content).
When these equations as rearranged it provides the classic shunt equation:
- Qs/Qt = CcO2 – CaO2/ CcO2 – CvO2
Key points
- The amount of oxygen inhaled is greatly different from the amount reaching the mitochondria
- The oxygen cascade describes the fall in oxygen as it passes from the air to the mitochondria
- Diffusion of gas is affected by molecular size, surface area and thickness of diffusion barrier and concentration gradient of the gas
- Oxygen content in the blood can be calculated by the flux equation
- CO2 is mainly carried as bicarbonate in the blood
- Deoxygenated haemoglobin is more effective at carrying CO2 than oxygenated haemoglobin
Clinical points
- CO, Hb saturation and haemogloblin concentration are the prime factors affecting oxygen delivery
- These factors can be manipulated by the anaesthetist to optimise a patient pre-operatively
- Insertion of haemodynamic monitoring, fluid therapy, transfusion, supplemental oxygen therapy and the correct use of inotropes are the key components in optimisation strategies to improve oxygen delivery
ANSWERS TO MCQS
- FFTTT – The oxyhaemoglobin dissociation curve is shifted to the left with a decrease in C02, 2,3 DPG, temperature and an alkalosis. Carbon monoxide prevents haemogloblin from releasing oxygen to the tissues therefore it causes a shift in the curve to the left.
- FFFTF – The nose and mouth act to filter and humidify gases as they flow into the lungs. There are 23 bronchial generations, 1-16 are the conducting zone and 17-23, the respiratory zone. The lungs are lined with columnar ciliated epithelium
- FFFFT – Dead space is the volume of gas which does not take part in gas exchange. It is classified into Anatomical, avelore and physiological which is a combination of both and can account for about 30% of tidal volume. Anatomical dead space is measured via Fowlers method and Physiological by the Bohr equation.
- TFTTF – PVR (pulmonary vascular resistance) = 80 x (MPAP – PCWP) / CO and is minimised at FRC and high at both low and high lung volumes. If it becomes a chronic problem it can lead to right sided lung failure. It is decreased by nitric oxide and prostacyclin – both have vasodilatory effects.
- FFFFF – Diffusion = Area/Thickness . (P1- P2) Diffusion has been best described by Fick and Grahams law.
- FFFFF – There is 15ml of oxygen on venous blood and 20ml per 100ml in oxygenated blood. O2 is carried mainly by haemoglobin whereas CO2 is transported as bicarbonate, caramino compounds or dissolved in blood. THe Haldane effect describes deoxygenated blood carrying CO2 better than oxygenated blood due to its effectiveness in forming carbamino compounds
WEB LINKS
- www.frca.co.uk
REFERENCES
- West J B, Respiratory Physiology The essentials
- Brandis K, The Physiology Viva
- Yentis S, Hirsch N, Smith G B, Anaesthesia and Intensive Care A-Z
This work by WFSA is licensed under a Creative Commons Attribution-NonCommercial-NoDerivitives 4.0 International License. To view this license, visit https://creativecommons.org/licenses/by-nc-nd/4.0/