Intensive Care Medicine

KEY POINTS
- Lung ultrasound relies on artefacts rather than direct anatomical visualization.
- It is useful in emergencies and also during the peri-operative period.
- Lung point-of-care ultrasound can evaluate pneumothorax, interstitial disease, and pleural effusion, and can assess the diaphragmatic function.
- Protocols, such as the ‘BLUE’ protocol, detect the causes of acute respiratory failure early with 90.5% accuracy.
INTRODUCTION
Lung point-of-care ultrasound (POCUS) is easy, noninvasive, and inexpensive for diagnosis and monitors response to therapy and spares radiation exposure. It results in a 76% change in the therapeutic strategy and identifies new pathology in 31% of cases.1 Compared to chest radiography, it provides higher sensitivity and specificity in detecting pneumothorax and pleural effusion, it better differentiates between pleural effusion and consolidation,2 and it is superior in detecting pneumonia.3 Ultrasonic assessment of the diaphragmatic function has high sensitivity (93%) and specificity (100%) in diagnosing phrenic nerve dysfunction.4 This tutorial discusses POCUS indications, the physics of ultrasound, standard exam approach and protocols, terminology, and pathology profiles and explores several applications of lung ultrasonography in monitoring and therapeutic interventions.
PHYSICS OF ULTRASOUND
Due to the different acoustic impedances between air and soft tissue, most waves are reflected at the pleura of a normally aerated lung. It is not possible to visualize normal lung parenchyma in contrast to cases of consolidation or collapse where lung tissue can be directly visualised. Pleural effusions can be visualised by ultrasound. Normally, the pleural layers are indistinguishable, and the hyperechoic pleural line and its artefacts are seen. A-lines are horizontal reverberation artefacts under the pleura at regular intervals, equivalent to the distance between the pleura and the probe.5
TERMINOLOGY
Table 1 defines terms that are used in lung ultrasonography.
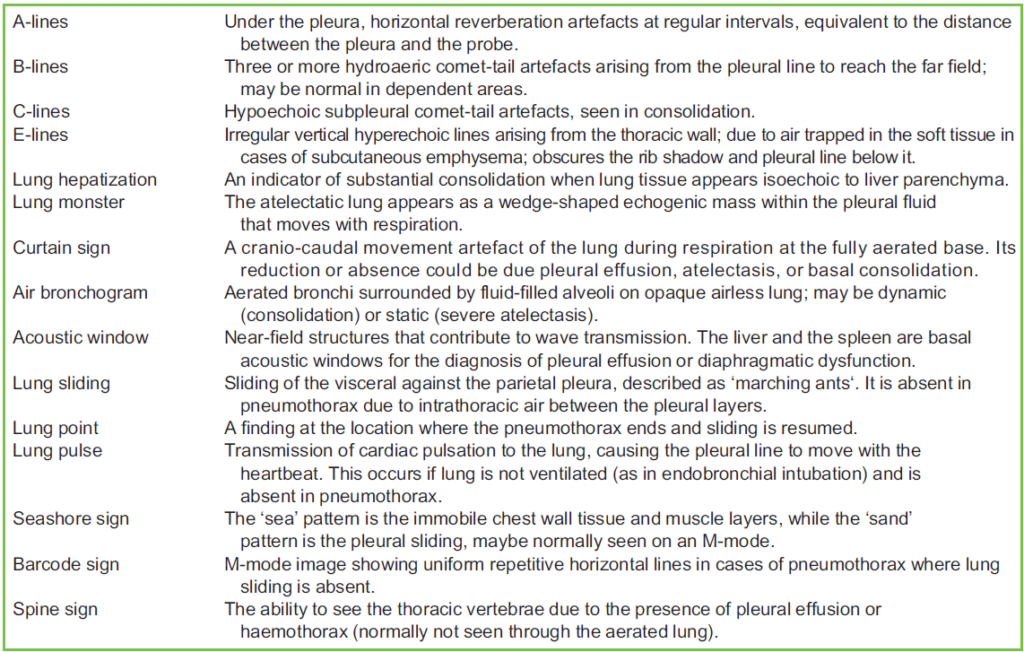
Table 1. Terminology of Lung Ultrasound6,7
INDICATIONS
Ultrasound of the lung is used in intensive care, in emergency medicine, and in the perioperative settings to evaluate any acute alteration of the respiratory status of critically ill patients. It is applied to diagnose the causes of hypoxia in patients with or without haemodynamic instability. The diaphragmatic ultrasound assessment has been used over the last 25 years8 to assess readiness for extubation, to detect neuromuscular disease, or to evaluate for potential phrenic nerve injury before and after brachial plexus nerve blocks. The ultrasound assessment of the parasternal intercostal muscle predicts weaning success.9
ULTRASOUND SELECTION AND PATIENT POSITIONING
A linear probe has the best resolution and is ideal for analysing pneumothorax or pulmonary oedema, while low-frequency probes examine deep artefacts as in effusions. The small phased array probe is helpful when evaluating small anterior intercostal spaces. The curvilinear probe has good penetration and is useful to check for effusions and it provides adequate views of the costo-phrenic angle, liver, and diaphragm. Patients are usually examined supine. Probes are placed anteriorly to check for pneumothorax, as air in the pleural space builds up anteriorly. When the patient is semiseated, the least dependent area is the apex. However, the clavicles make imaging more challenging. The probe is placed posterolateral when looking for a dependent pathology, such as consolidation, effusion, or hemothorax.10
STANDARD EXAM APPROACH
In lung POCUS, we look for pneumothorax, interstitial disease, and pleural effusion, and assess the diaphragmatic function. Six zones are examined (bilateral anterior, posterior, and lateral), and 3 intercostal spaces are examined in each zone (Figure 1). To rule out pneumothorax, B-mode is used to verify lung sliding and ensure the absence of a lung point extensively.
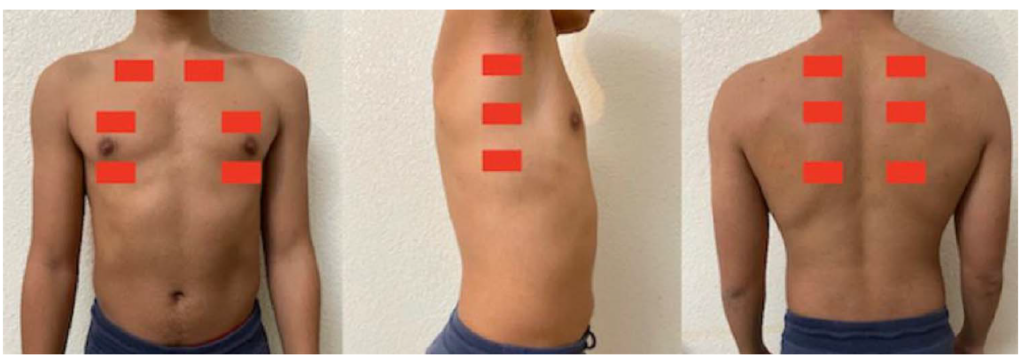
Figure 1. The 6 scanning zones of the lung (bilateral anterior, posterior, and lateral), and 3 intercostal spaces are examined in each zone.
We look for B-lines to look for conditions with increased interstitial fluid or thickness, including pulmonary oedema, COVID-19, acute respiratory distress syndrome (ARDS), transfusion-related acute lung injury, and pulmonary fibrosis. The purpose of obtaining a coronal image at the posterior axillary line is to visualize a pleural effusion. An anechoic collection cephalad to the diaphragm indicates pleural effusion. The small size of the spleen makes imaging more difficult on the left side.11
PATHOLOGY PROFILES
Pneumothorax
Static plural air generates total reflection waves, resulting in the absence of lung sliding (sliding of the visceral against the parietal pleura in B-mode, described as ‘marching ants’). It is absent in pneumothorax due to intrathoracic air between the pleural layers (Figure 2). In M-mode, the barcode sign replaces the seashore sign (Figures 3 and 4). Lung sliding is also abolished in endobronchial intubation, pleuro-parenchymal adhesions, subpleural bullae, postpneumonectomy, and after pleurodesis. Lung sliding is therefore sensitive but not specific to pneumothorax. The lung point (a finding at the location where the pneumothorax ends and sliding is resumed) is the most specific (100% specificity) ultrasound finding of pneumothorax (Figure 5). Hence, this should be routinely sought in the absence of sliding to estimate the size of the pneumothorax.6
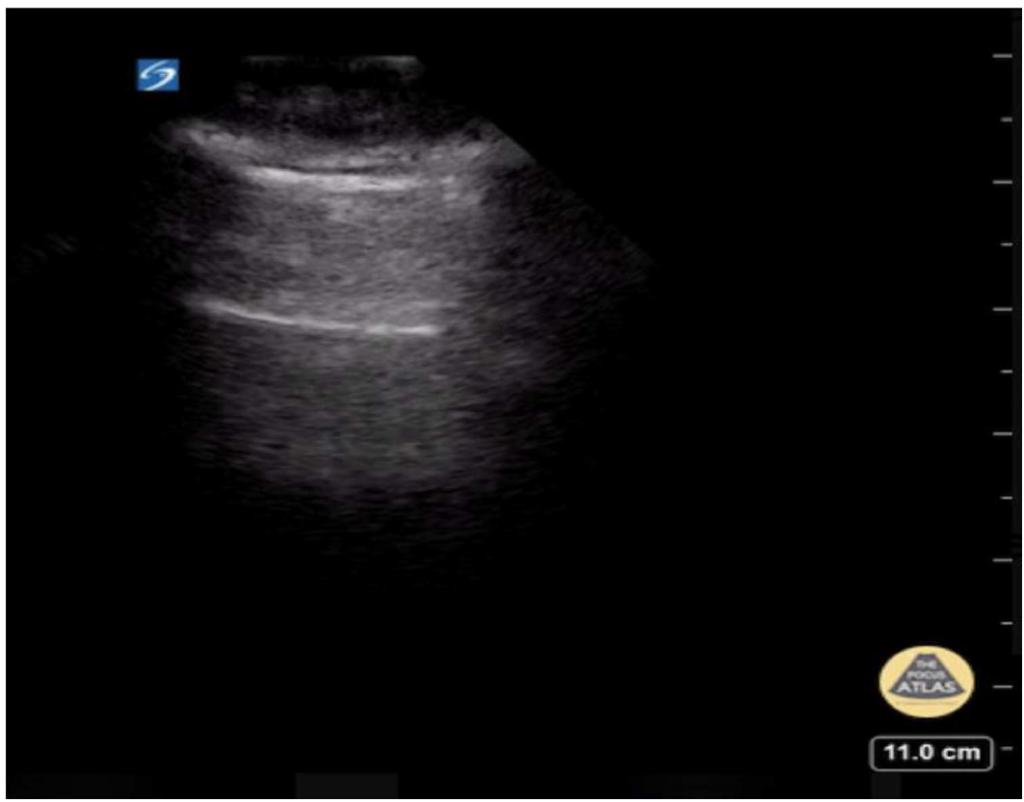
Figure 2. The upper hyperechoic is the pleural line where lung sliding occurs, whereas the lower horizontal hyperechoic line represents an A-line. Image supplied by Hannah Kopinski (MS4) and Dr Lindsay Davis of NYU Emergency Medicine and Matthew Riscinti, Kings County Emergency Medicine.
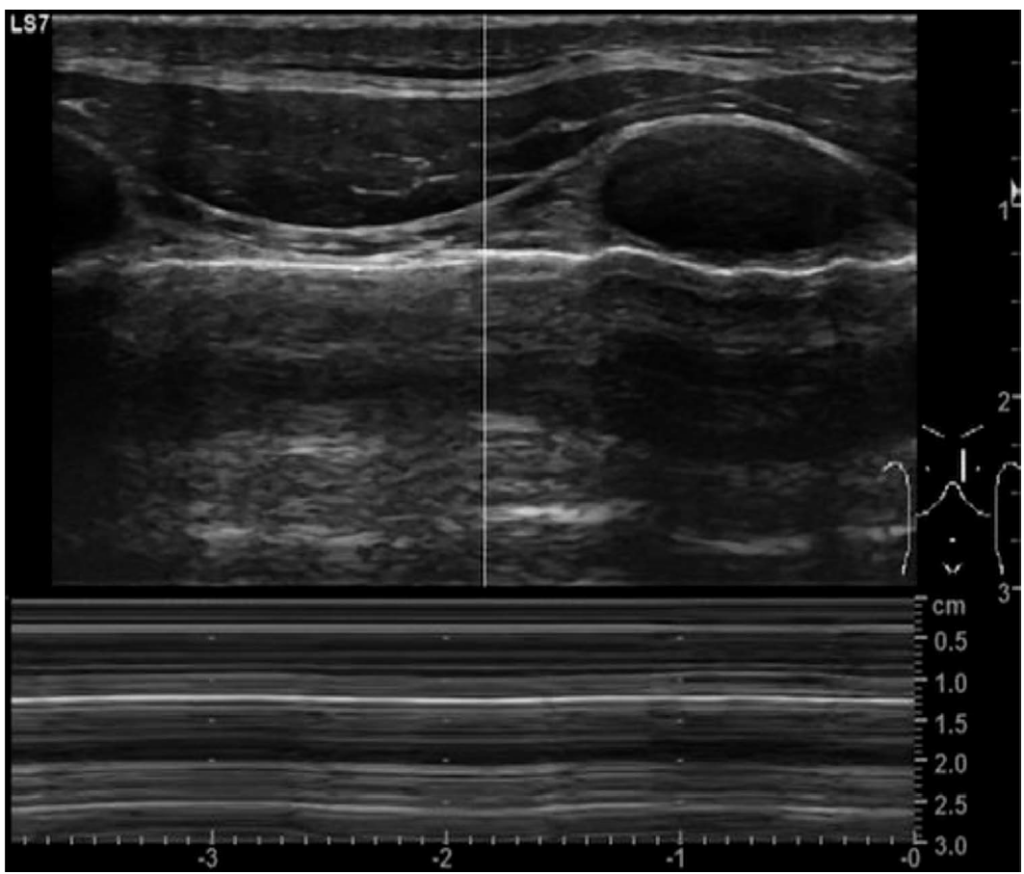
Figure 3. M-mode image showing a barcode sign due to pneumothorax. Case courtesy of Maulik S. Patel, Radiopaedia.org, rID: 61141.
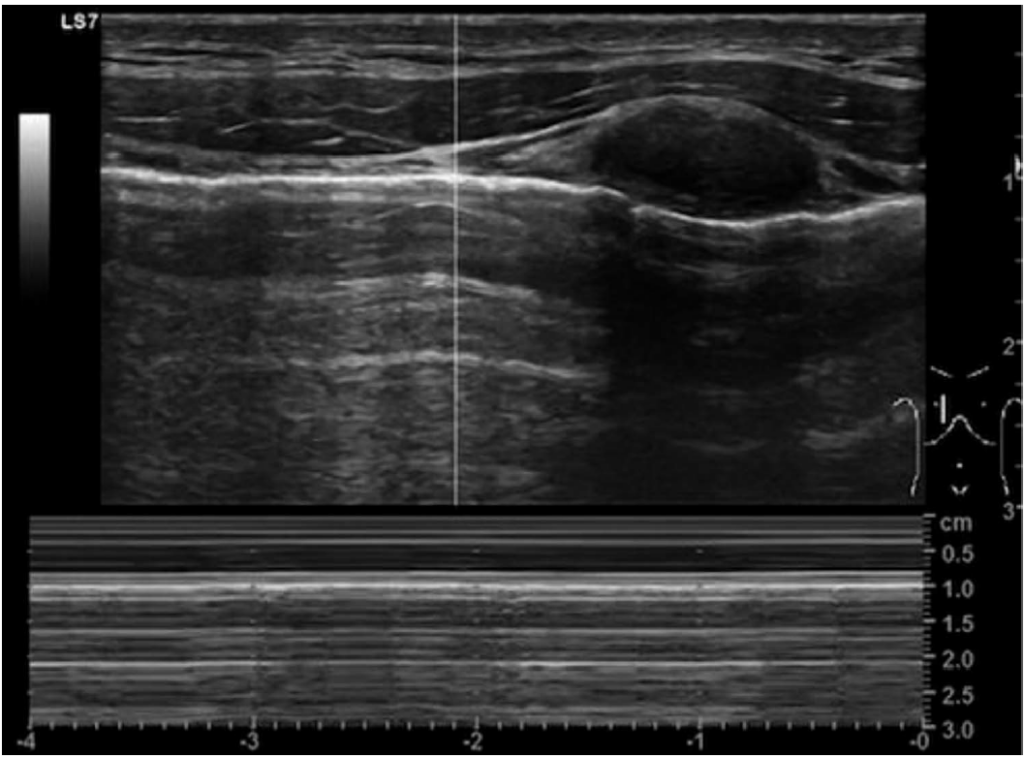
Figure 4. M-mode image of a normal lung showing a seashore sign. Case courtesy of Maulik S. Patel, Radiopaedia.org, rID: 61141.
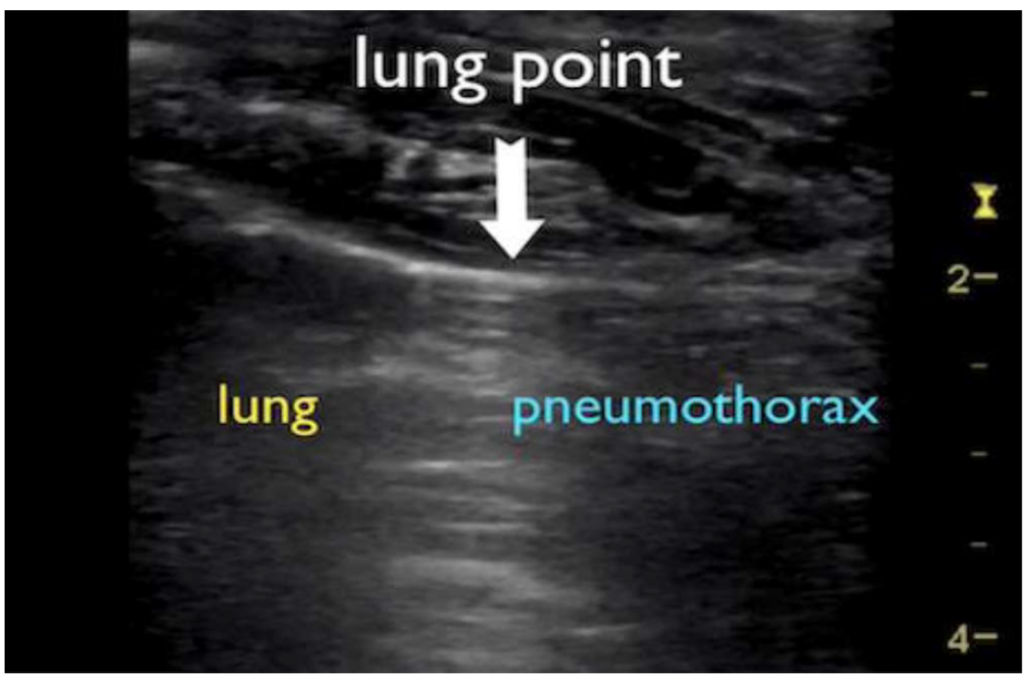
Figure 5. B-mode image showing a lung point where the pneumothorax ends and sliding is resumed. Case courtesy of Andrew Dixon, Radiopaedia.org, rID: 45149.
Pleural Effusion
A simple effusion appears as an anechoic space between the pleural layers (Figure 6). Ultrasound can detect as little as 5 to 20 mL of pleural fluid with a sensitivity of 89% to 100% and a specificity of 96% to 100% while in a chest x-ray, this may be evident only if the volume reaches 175 to 525 mL. A large effusion can also show the ‘lung monster sign’ (Figure 7), or the ‘spine sign’ can also be seen (Figure 8).6,11
Pneumonia
Pneumonia increases fluid content and reduces aeration in the lung parenchyma, reducing the acoustic discrepancies between the thoracic wall and lung parenchyma. In lung consolidation, the resultant hepatisation produces heterogeneous hyperechoic regions with irregular, variable-sized and -shaped borders (Figure 9).
Sonographic air bronchograms are caused by extreme perturbation of the air-fluid relationship in the lung parenchyma. The fluid-filled alveoli act as an excellent acoustic medium and allow visualization of the lung parenchyma. The bronchial tree is represented by branching tubular structures, which when patent, appear to contain punctiform to linear foci. These structures may remain fixed in position
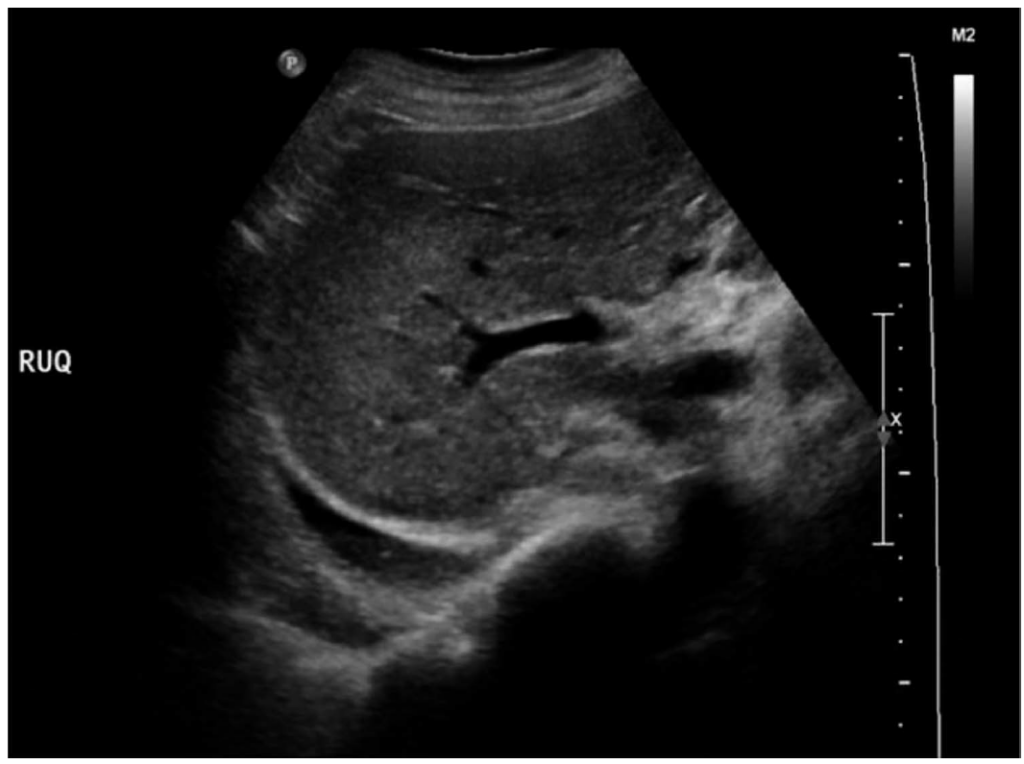
Figure 6. Image showing a right-sided pleural effusion. Case courtesy of Hani Makky Al Salam, Radiopaedia.org, rID: 13266.
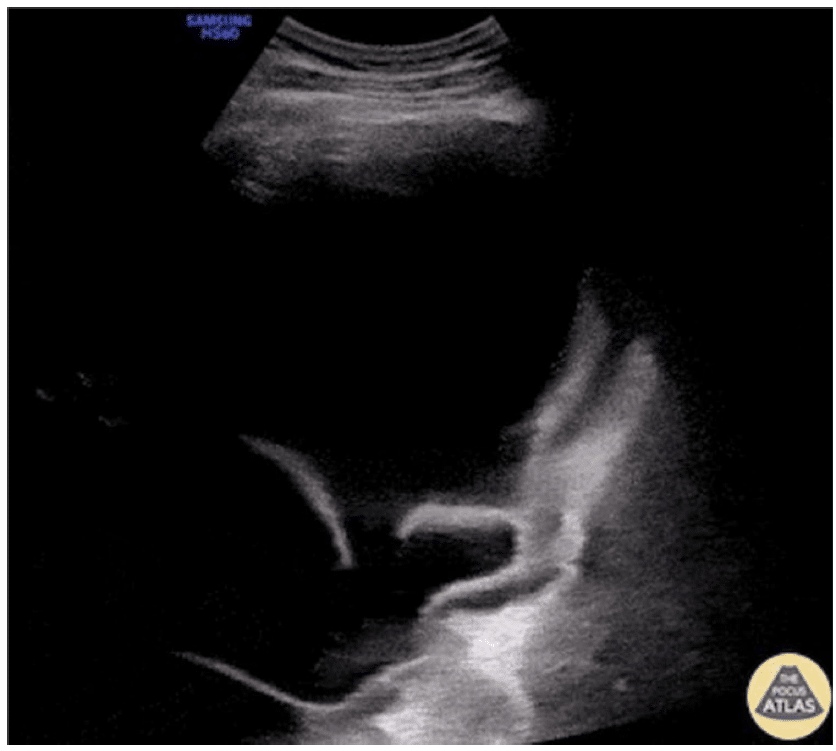
Figure 7. A large septal pleural effusion, showing the irregular and thickened pleura adjacent to the diaphragm. Image supplied by Victor Speidel, Langenthal Regional Hospital, Switzerland.
(static) throughout the respiratory cycle or be observed to propagate centrifugally with respiration (dynamic). Static air bronchograms indicate isolated, trapped air, diagnostic of resorptive atelectasis. Dynamic air bronchograms represent fluid mixed with air inside larger bronchi. They indicate nonretractile consolidation and have a specificity of 94% and a positive predictive value of 97% for consolidation secondary to pneumonia. Using colour Doppler ultrasonography, the branching pattern of vascular flow within the consolidation can be observed (Figure 10).6
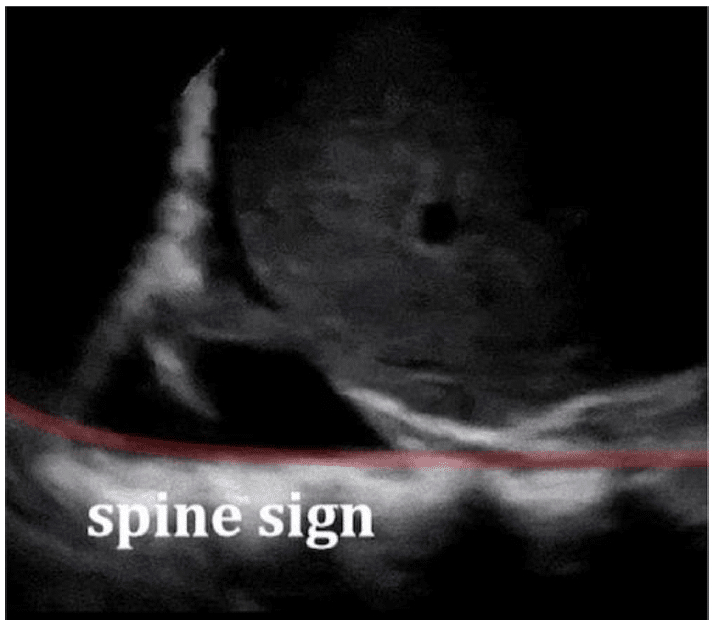
Figure 8. A right longitudinal subcostal scan, showing a right-sided pleural effusion and a positive spine sign. Case courtesy of David Carroll, Radiopaedia.org, rID: 65725.
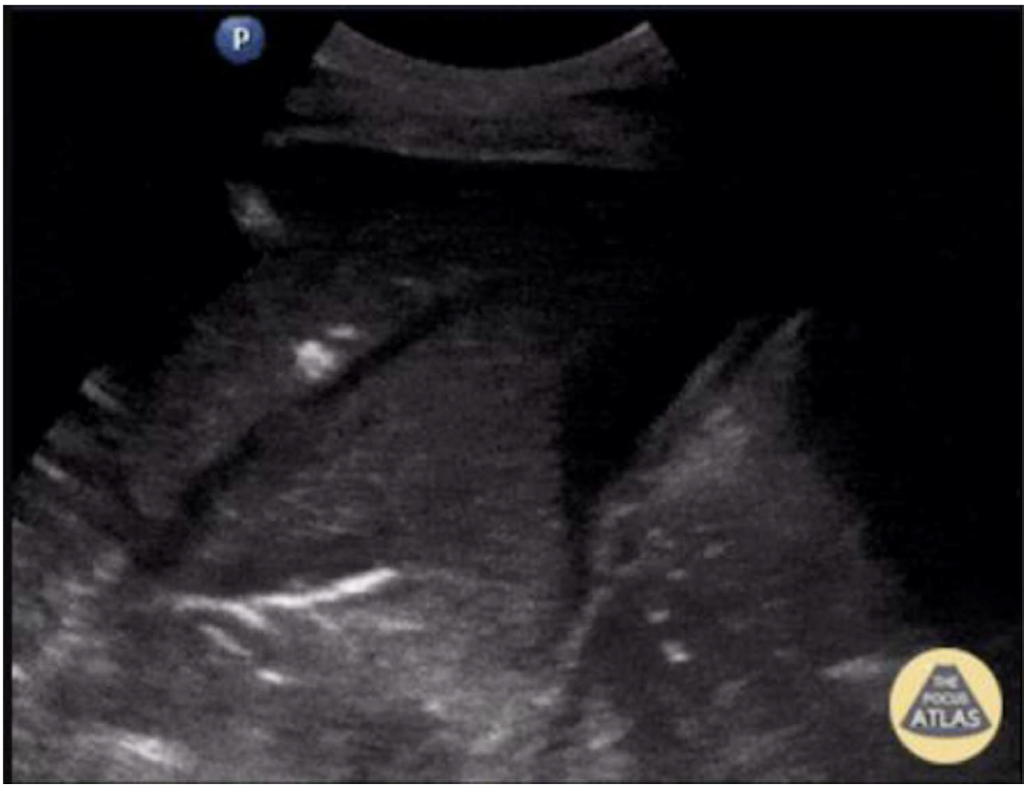
Figure 9. The left lower lobe, showing a consolidation with a hepatization echogenic pattern. These abnormal findings are suggestive of pneumonia. Image supplied by Johannes Achenbach.
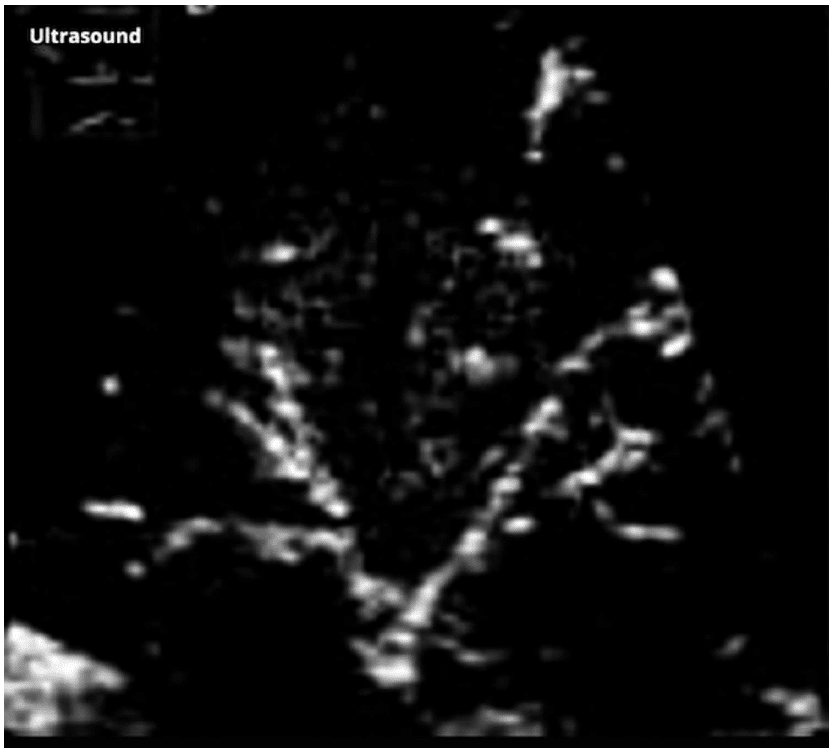
Figure 10. Air bronchogram within a consolidated lung tissue presenting as echogenic branching structures. Case courtesy of G. Balachandran, Radiopaedia.org, rID: 12505.
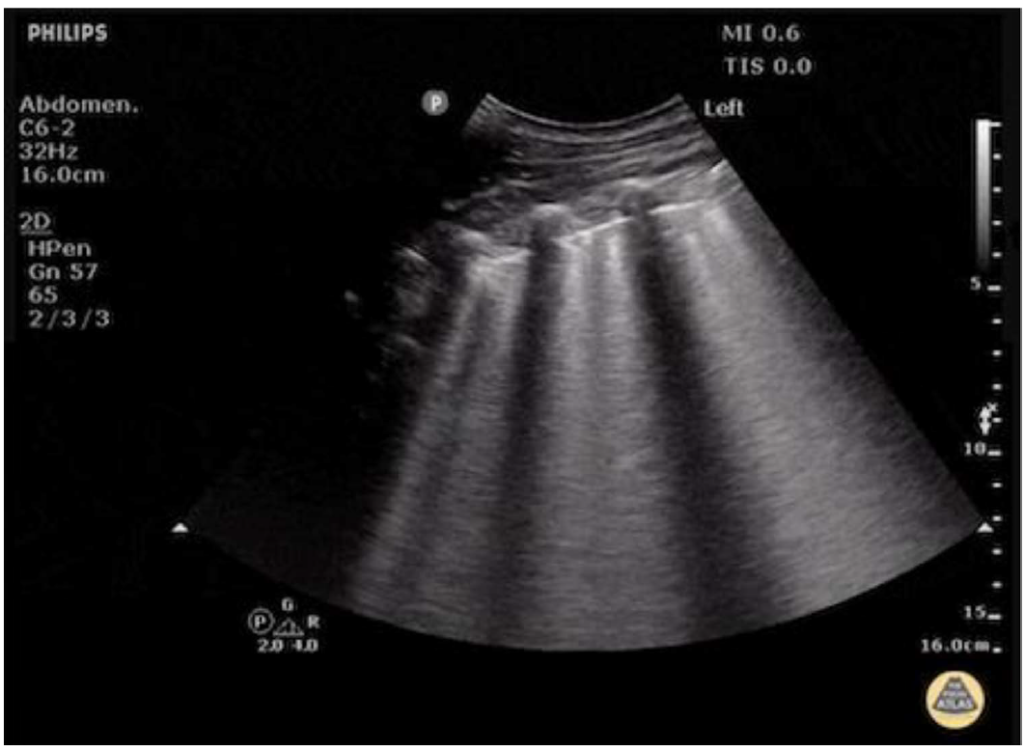
Figure 11. A case of pulmonary edema with multiple B-lines. Image supplied by Dr Justin Bowra, Dr D. Browne and Dr J. Knights.
Acute Alveolar-Interstitial Syndrome
Fluid leaks into the pulmonary interstitium and alveoli when the lung’s water level is high and the alveolar air content is low as a result of the high water content. This is seen sonologically as B lines, which are 3 or more hydroaeric comet-tail artefacts arising from the pleural line to reach the far field. It may be normal in dependent areas.6
Pulmonary Oedema
Multiple B-lines may precede radiographic changes. These are seen on each image in different zones bilaterally. Three B-lines with a convex probe or 6 B-lines with a linear probe is pathognomonic of pulmonary oedema. The degree of pulmonary oedema will correlate with the number of B-lines. A reduction or disappearance of the B-lines ultrasonographically can be correlated with symptomatic improvement and reduction or clearing of chest x-ray changes (Figure 11).6
Acute Respiratory Distress Syndrome
In ARDS, lung ultrasound will demonstrate multiple B-lines with an irregular pattern, and small posterior and basal consolidations, along with an air bronchogram.6
Diaphragm Dysfunction
The diaphragmatic function assessment is attained by measuring excursions in the subxiphoid view using a curvilinear transducer at the M-mode during deep inspiration. Normal excursion values among men and women during quiet and deep breathing, as well as in the sniffing test, are illustrated in Table 2 (Figures 12 and 13). In partial phrenic palsy, the sniff test shows partial hemidiaphragmatic paresis with a 25% to 75% reduction in caudal movement of the diaphragm (towards the transducer). In complete phrenic palsy, a paradoxical cephalad movement or a 75% or greater reduction in movement is seen. The second method is to
Table 2. Different Normal Values for Diaphragmatic Excursion
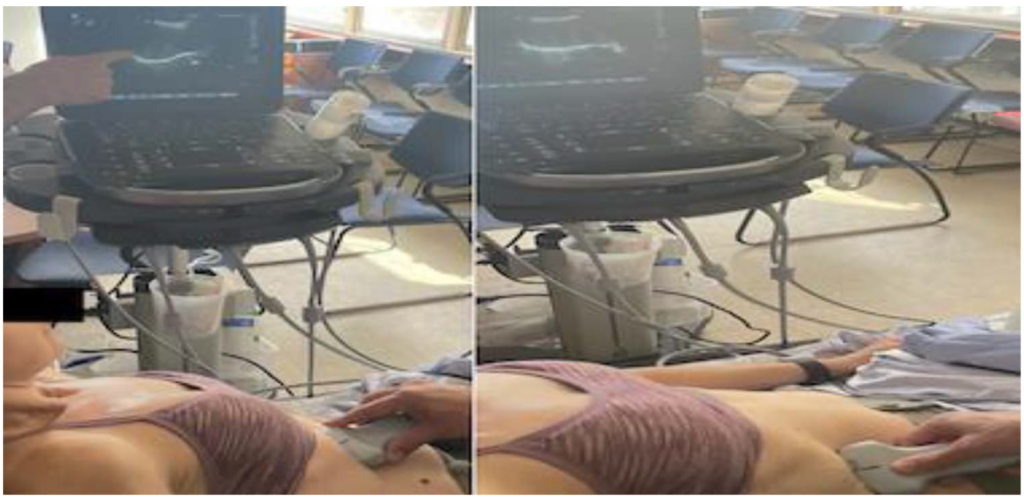
Figure 12. The diaphragmatic excursion in B-mode resulting in a caudal movement of the diaphragm (towards the transducer) during inspiration (right image) compared to the expiratory phase (left image).
measure changes in the diaphragmatic thickness during inspiration (Figure 14). This is obtained by placing the linear probe in the ninth intercostal space at the anterior axillary line. A thickness of less than 0.2 cm at the end of expiration defines diaphragm atrophy. The formula used to measure the change of thickness (TFdi) at M-mode is (thickness at end-inspiration minus thickness at end-expiration)/thickness at end-expiration. A thickening of less than 20% is consistent with paralysis. A third method is to monitor the descent of the pleural line with inspiration ‘diaphragmatic displacement’ using a linear probe in the coronal plane at the midaxillary line to obtain a view between the seventh and eighth ribs on the right side or the eighth and ninth ribs on the left side.4
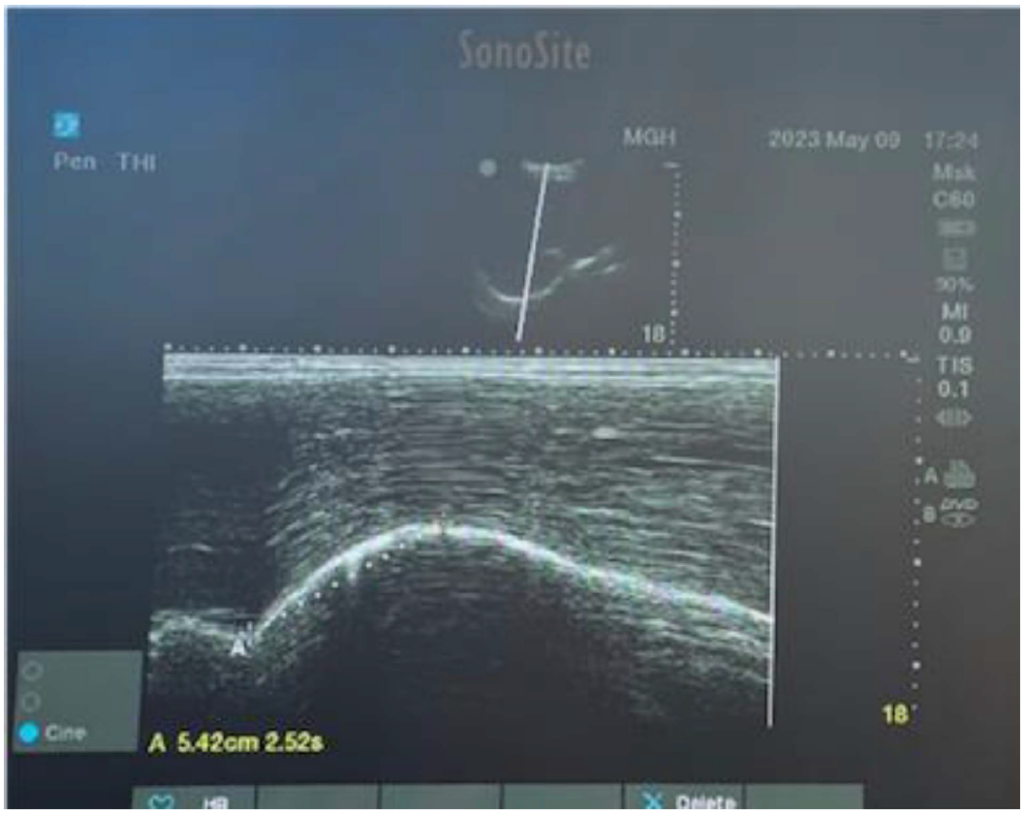
Figure 13. Quantifying the level of the diaphragmatic excursion using the M-mode during deep inspiration in a healthy female volunteer. A dotted line between the point of the end expiratory phase to the point of the maximum inspiration gave a normal value of 5.42 cm.
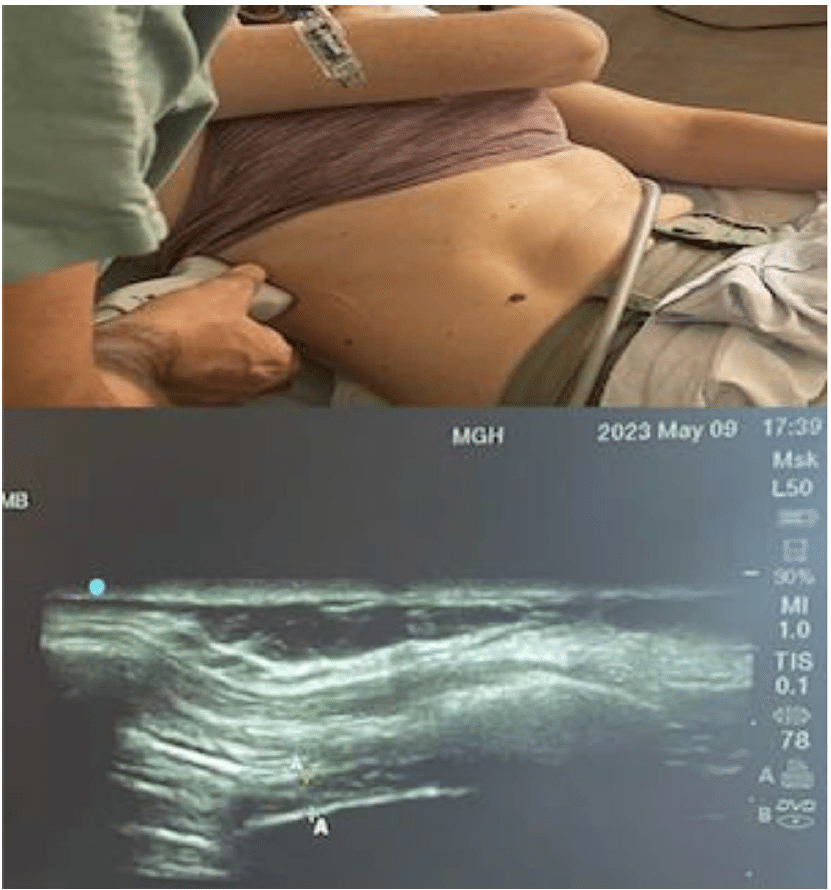
Figure 14. Upper image illustrates how to get a diaphragmatic ultrasound image to measure thickness. A linear probe is placed in the ninth intercostal space at the anterior axillary line. Lower image identifies the 3 layers of the diaphragm at B-mode, and measures thickness during inspiration as an indirect measurement for hemi-diaphragmatic paresis.
Parasternal Intercostal Muscle Assessment
A linear probe is placed 3 to 5 cm lateral to the sternum, in the sagittal plane between the second and third ribs. Starting in B-mode, the muscle is seen as a 3-layered biconcave structure above the pleural line (Figure 15). Thickness is measured between the hyperechogenic inner and outermost layers midpoint between the ribs. Using the M-mode, the external intercostal muscle thickening during inspiration is seen. TFic can be calculated by this calculation: (TH end-inspiration – TH end-expiration)/TH end-expiration) 3 100, where TH ¼ thickness. An excessive inspiratory support causes atrophy of the breathing muscles. TFic more than 8% is seen in patients with diaphragmatic dysfunction, and a value exceeding 10% can predict weaning failure. Once we initiate pressure support or spontaneous breathing trial and patients fail weaning within 24 hours, TFdi and TFic should be measured. Values of TFdi greater than 20% and TFic less than 10% predict weaning success.9
Subcutaneous Emphysema
Subcutaneous emphysema is the accumulation of air in soft tissues, both subcutaneous and intramuscular. Air leaks can come from nontraumatic causes or traumatic or iatrogenic injuries, such as rib fractures, airway or esophageal trauma, gas-forming infections, or chest or endotracheal tube insertion. It can be diagnosed by the presence of soft- tissue oedema, crepitus, and air in the thoracic wall at radiography. Ultrasonography shows subcutaneous emphysema causing several vertical hyperechoic lines (E-lines) arising from the thoracic wall to the pleural line (Figure 16). The E-lines at the screen margin eliminate the pleural line. Sometimes, the anterior cortex of the ribs becomes invisible, causing the typical bat sign to be lost. It should be noticed that E-lines differ from B-lines, which originate from the pleural line. As traumatic subcutaneous emphysema is linked to pneumothorax, it should be looked for in other regions where the pleural line is visible.6
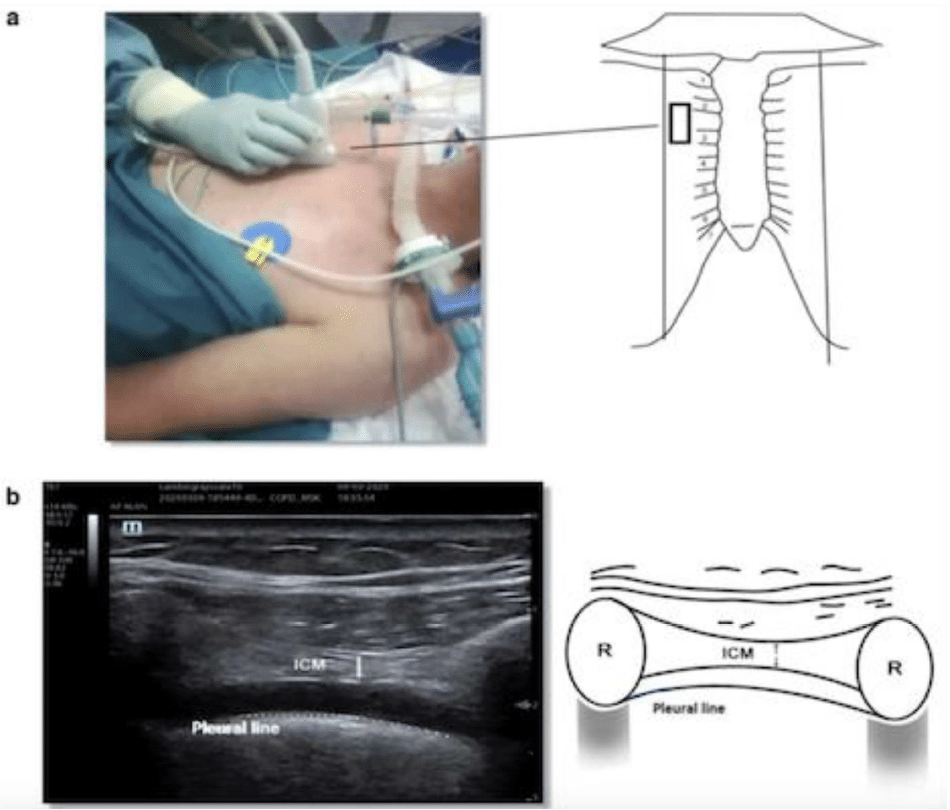
Figure 15. Intercostal muscle ultrasound. (a) The probe is placed at the parasternal space. (b) A B-mode image showing the intercostal muscle (ICM). Adapted from Formenti, Paolo, et al. “Ultrasonographic assessment of parasternal intercostal muscles during mechanical ventilation.” Annals of Intensive Care 10.1 (2020):1-9. http://creativecommons.org/licenses/by/4.0/.
THE BLUE PROTOCOL
This tool usually takes 3 minutes to diagnose the cause of acute respiratory failure with 90.5% accuracy. To find the upper and lower BLUE points, place 4 fingers (except the thumb) of the left hand below the clavicle on the right side of the patient with the fingertips on the sternum. The upper point is at the base of the second and third fingers. The lower point is in the centre of the palm when the right hand is placed below the left with the forefingers touching. Switch sides and repeat. We proceed to scan the base of the lungs only if the scan up to this point is nondiagnostic (Figure 17). To locate this point at the thoracic-abdominal border, move from the lower BLUE point around the chest wall to the posterior axillary line. The BLUE protocol employs signs and correlates them with a location, resulting in 7 profiles (Table 3); each is associated with a pathology (Figure 18).7
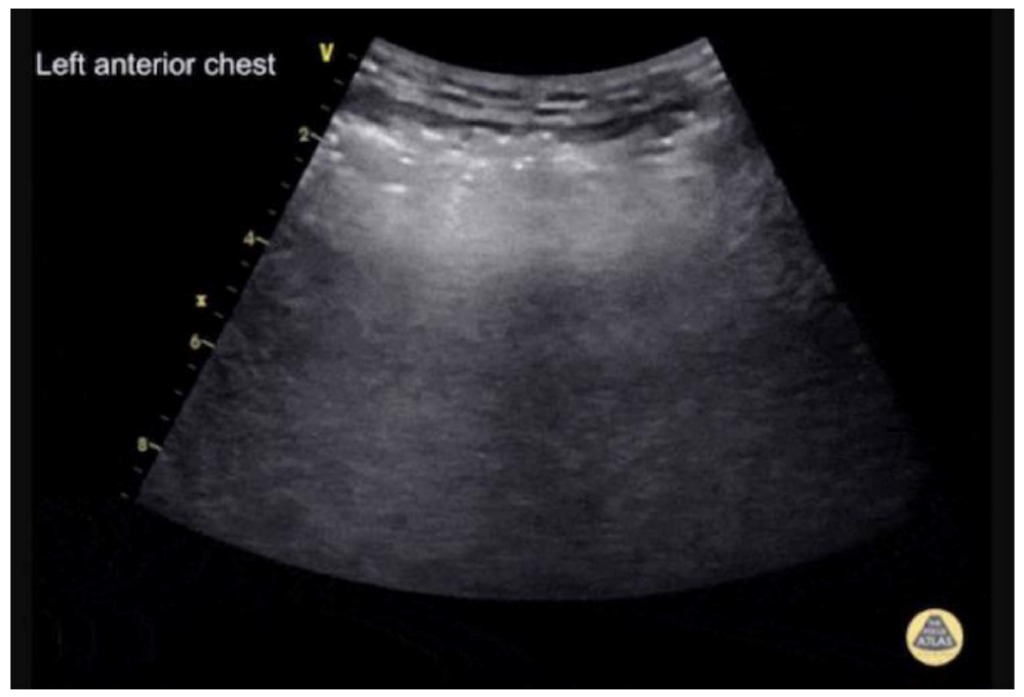
Figure 16. Subcutaneous emphysema in the left anterior chest wall using a curvilinear transducer. Hyperechoic irregular vertical lines can be seen above the level of the ribs (E lines). Image supplied by Dr Cian McDermott.
THE BLUE-PLUS PROTOCOL
There is a significant incidence of lung consolidation and atelectasis during mechanical ventilation in critically ill patients. Due to the BLUE protocol’s relatively low sensitivity in identifying pulmonary consolidation, Wang et al12 developed the BLUE-plus protocol. Patients are first made to lie supine so that the BLUE protocol can be used to measure the bilateral upper and lower blue points, the posterior and/or lateral alveolar and/or pleural syndrome points, and the diaphragmatic points. The posterior BLUE points are then measured with the patients in their lateral decubitus position. The midpoint between the vertebral line and the scapular line, just below the scapula, is identified as the posterior BLUE point. The BLUE-plus protocol was found to have higher sensitivity, specificity, and diagnostic accuracy (95.71%, 87.50%, and 94.87%, respectively) to detect lung consolidation and atelectasis, especially for the lesions located in the base of the lung, when compared to the BLUE protocol, bedside chest x-ray, and lung computed tomography scan.12
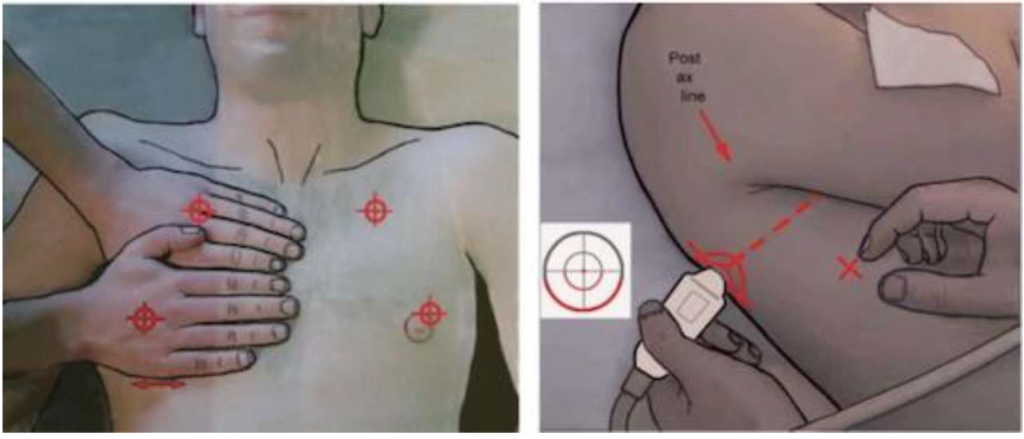
Figure 17. Left: The upper and lower anterior BLUE points. The diaphragm is located at the bottom of the lower hand. Right: We proceed to scan the base of the lungs only if the scan up to this point is nondiagnostic. Adapted from Lichtenstein, Daniel A. “Lung ultrasound in the critically ill.” Annals of intensive care 4.1 (2014):1-12. https://creativecommons.org/licenses/by/2.0.
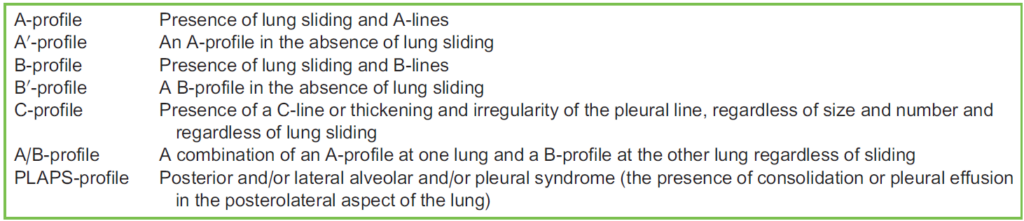
Table 3. The 7 Profiles of the BLUE Protocol
ROLES IN MONITORING AND THERAPEUTIC INTERVENTIONS
Monitoring and Drainage of Pleural Effusion
Lung ultrasonography can assist in measuring the volume of pleural effusion and, to some extent, in determining its nature. In the supine position, an interpleural distance at the lung base above 50 mm, as measured between the lung and the posterior chest wall, strongly suggests the presence of a pleural effusion equal to or greater than 500 mL. The accuracy is insufficient for quantifying small (s 500 mL) and high ($ 1000 mL) volumes. The calculation involves the multiplication of the pleural effusion’s height by its transversal area. In terms of the nature of pleural effusion, transudates exhibit anechoic characteristics but exudates display echogenicity and loculation. Lung ultrasound enables the safe thoracic drainage of small and/or loculated pleural effusions, can detect pleural adherences, may reduce the risk of intrafissural or intraparenchymal placement of thoracic tubes, and reduces the risk of vascular injuries when a colour Doppler is used.13
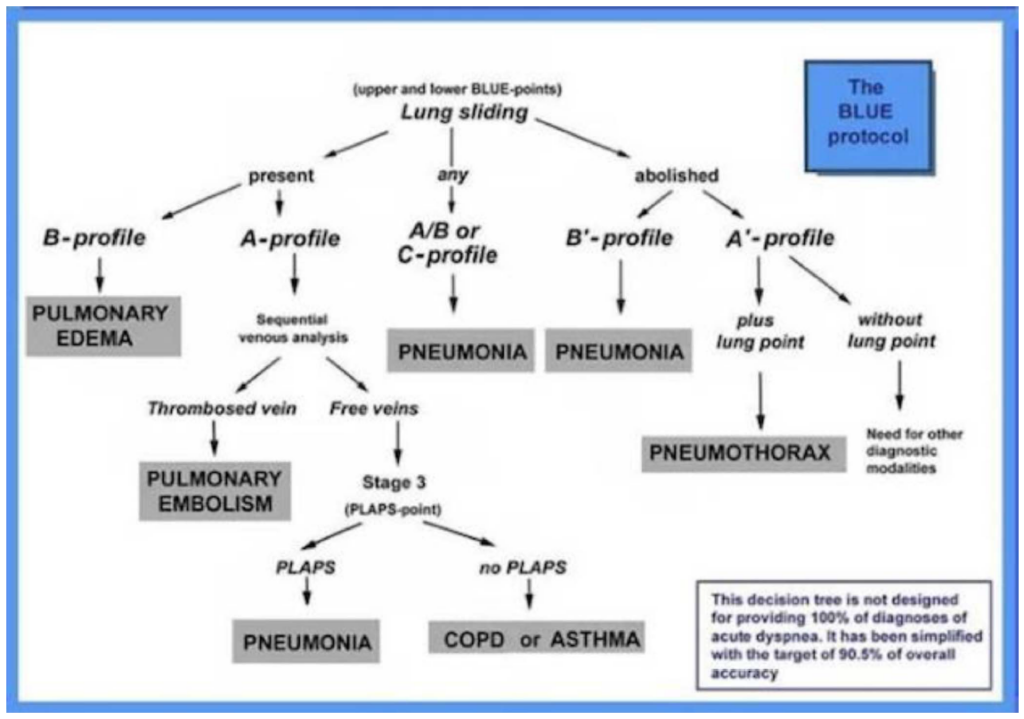
Figure 18. The BLUE protocol decision tree. Adapted from Lichtenstein, Daniel A. “Lung ultrasound in the critically ill.” Annals of intensive care 4.1 (2014): 1-12. https://creativecommons.org/licenses/by/2.0.
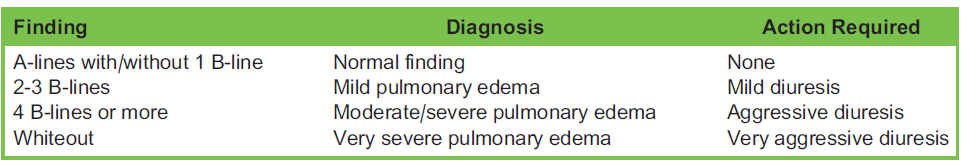
Table 4. The Classification of Pulmonary Edema and the Establishment of Targeted Volume Management
Guiding Diuretic Therapy in Cases With Pulmonary Oedema
The application of lung ultrasound in identifying pulmonary oedema during fluid resuscitation in circulatory shock, known as the ‘fluid administration limited by lung sonography’ (FALLS) protocol, has been well documented. However, the introduction of the reverse-FALLS protocol integrates aspects of lung and inferior vena cava ultrasound to evaluate the extra- vascular and intravascular compartments, respectively, in order to guide fluid removal. The quantification of pulmonary oedema is achieved by counting the number of B-lines observed in each scan plane. This will help determine whether or not aggressive diuretic therapy is indicated (Table 4), while measuring the minimum and maximum anteroposterior inferior vena cava diameter using the M-mode throughout a full respiratory cycle will help answer whether aggressive diuretic treatment can be tolerated.14
SUMMARY
Lung POCUS is an easy and quick technique that aims to diagnose causes of respiratory failure. The BLUE protocol examines standardized points on each hemithorax to check for certain findings, then, a pathophysiologic profile is created. However, it is more important to examine the whole chest than to follow a certain protocol. Regarding the diaphragmatic assessment for a possible phrenic nerve palsy associated with regional anaesthesia, it is important to take baseline mea- sures in order to compare them with the findings after the block. It is also important to know that when we measure TFdi and TFic as predictive tools for weaning, we should incorporate these measurements with other parameters predictive of weaning failure.
REFERENCES
Ramsingh D, Rinehart J, Kain Z, et al. Impact assessment of perioperative point-of-care ultrasound training on anesthesiology residents. Anesthesiology. 2015;123(3):670-682.
Ding W, Shen Y, Yang J, He X, Zhang M. Diagnosis of pneumothorax by radiography and ultrasonography: a meta-analysis.Chest. 2011;140(4):859-866.
Liu X-L, Lian R, Tao Y-K, Gu C-D, Zhang G-Q. Lung ultrasonography: an effective way to diagnose community-acquired pneumonia. Emerg Med J. 2015;32(6):433-438.- El-Boghdadly K, Chin KJ, Chan VW. Phrenic nerve palsy and regional anesthesia for shoulder surgery: anatomical, physio- logic, and clinical considerations. Anesthesiology. 2017;127(1):173-191.
Marini TJ, Rubens DJ, Zhao YT, et al. Lung ultrasound: the essentials. Radiol Cardiothorac Imaging. 2021;3(2):e200564.- Wongwaisayawan S, Suwannanon R, Sawatmongkorngul S, Kaewlai R. Emergency thoracic US: the essentials. Radiographics. 2016;36(3):640-659.
Lichtenstein DA. Lung ultrasound in the critically ill. Ann Intensive Care. 2014;4(1):1-12.
Boussuges A, Rives S, Finance J, Bre´geon F. Assessment of diaphragmatic function by ultrasonography: current approach and perspectives. World J Clin Cases. 2020;8(12):2408.
Formenti P, Umbrello M, Dres M, Chiumello D. Ultrasonographic assessment of parasternal intercostal muscles during mechanical ventilation. Ann Intensive Care. 2020;10(1):1-9.
Li L, Yong RJ, Kaye AD, Urman RD. Perioperative point of care ultrasound (POCUS) for anesthesiologists: an overview. Curr Pain Headache Rep. 2020;24:1-15.
Manson W HR. How I do it: lung ultrasound. ASRA Pain Med News. 2022;47. doi:10.52211/asra020122.005- Wang X, Liu D, Zhang H, et al. The value of bedside lung ultrasound in emergency—plus protocol for the assessment of lung consolidation and atelectasis in critical patients [in Chinese]. Zhonghua nei ke za zhi. 2012;51(12):948-951.
Bouhemad B, Zhang M, Lu Q, Rouby J-J. Clinical review: bedside lung ultrasound in critical care practice. Crit Care. 2007;11:1-9.
O’Hara DN, Chabra V, Ahmad S. Bedside ultrasound for guiding fluid removal in patients with pulmonary edema: the reverse- FALLS protocol. J Vis Exp. 2018(137):e57631.
This work by WFSA is licensed under a Creative Commons Attribution-NonCommercial-NoDerivitives 4.0 International License. To view this license, visit https://creativecommons.org/licenses/by-nc-nd/4.0/